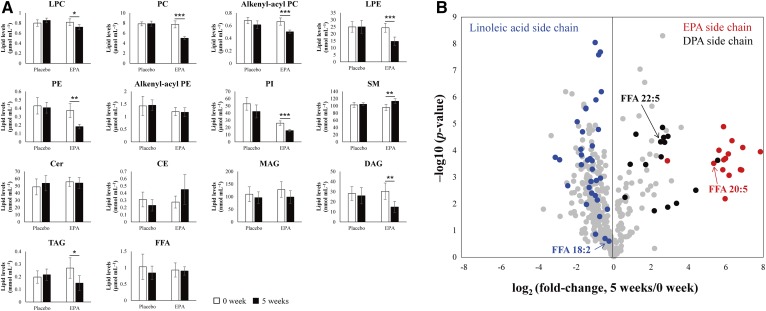
Fig. 5.
Response of alteration of plasma lipid levels in WHHLMI to the supplementation of EPA. A: Plasma concentration of each lipid class in the placebo group and the EPA administration group. Error bars indicate the SDs of biological replicates (n = 6). Statistical significance was determined using paired t-test. * P < 0.05; ** P < 0.01; *** P < 0.001. B: Individual plasma lipid profiles of before (0 weeks) and after (5 weeks) administration of EPA by volcano plot. Red, black, and blue closed circles indicate the lipid molecular species with EPA side chain, DPA side chain, and linoleic acid side chain, respectively.

