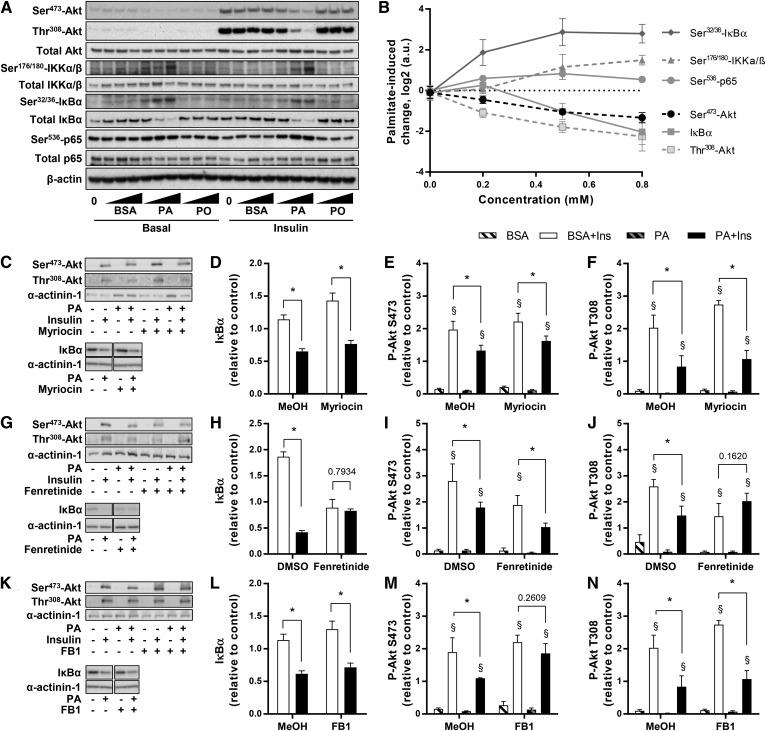
Fig. 6.
Insulin and inflammatory signaling pathways. A, B: L6 myotubes were exposed to 0, 0.2, 0.5, or 0.8 mM PA or PO for 18 h, serum starved for 2 h, and stimulated with 2 nM insulin for 10 min. Akt, IKK, IκBα, and p65 were measured using specific antibodies. C–F: Effect of PA and myriocin was measured by Western blot for insulin-stimulated phosphorylation of Akt [n ≥ 3; three-way ANOVA (insulin, PA, myriocin)] and degradation of IκBα [n = 6; two-way ANOVA (PA, myriocin)]. G–J: Effect of PA and fenretinide was measured by Western blot for insulin-stimulated phosphorylation of Akt [n ≥ 3; three-way ANOVA (insulin, PA, fenretinide)] and degradation of IκBα [n = 6; two-way ANOVA (PA, fenretinide)]. K–N: Effect of PA and FB1 was measured by Western blot for insulin-stimulated phosphorylation of Akt [n ≥ 3; three-way ANOVA (insulin, PA, FB1)] and degradation of IκBα [n = 6; two-way ANOVA (PA, FB1)]. *Significant effect of PA over BSA control (two-way ANOVA; P < 0.05). §Significant effect of insulin over unstimulated control (P < 0.05). MeOH, methanol.

