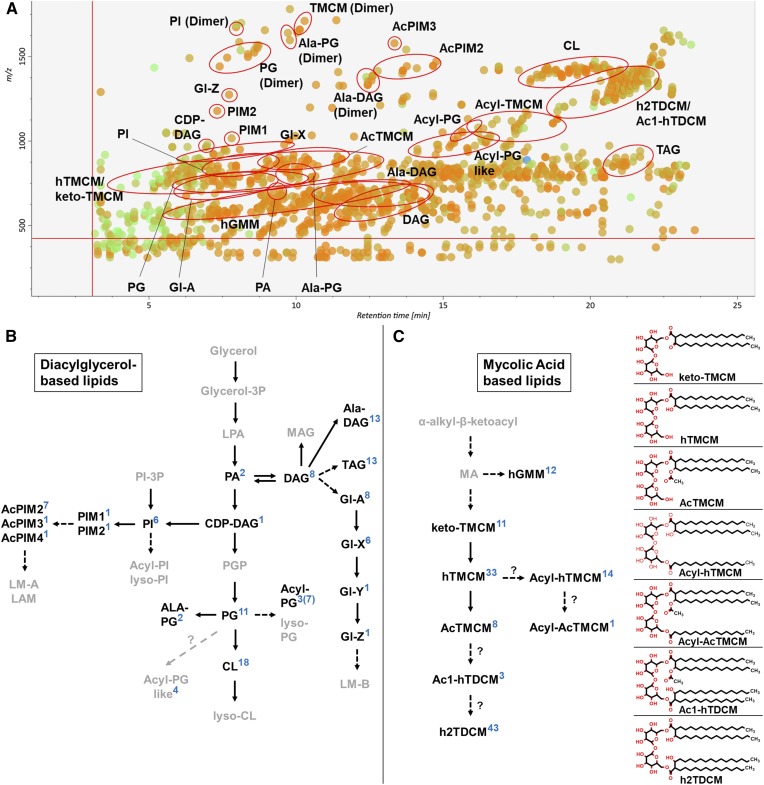
Fig. 1.
LC-MS analysis of C. glutamicum lipids. A: MS/MS peak spot viewer of the C. glutamicum WT tTL fraction in MS-DIAL. The retention time (x axis) is plotted against the mass/charge ratio (y axis). Blue spots represent peaks of lower abundance based on peak area, green of intermediate abundance, and red of high abundance. A total of 174 lipid species (26 subclasses) were detected in the TL fraction of WT C. glutamicum. Each lipid (sub)class is highlighted with a red circle in the peak spot viewer of the MS-DIAL software. Note that not every spot within a circle belongs to the lipid (sub)class. B, C: Overview of pathways involved in DAG-based (B) and MA-based (C) lipid biosynthesis. Lipid (sub)classes identified via LC-MS/MS ESI QTOF in positive ionization mode using the established lipid libraries in MS-DIAL are in bold. The number of identified species in each lipid (sub)class are indicated in blue. Altogether, 233 lipids across 28 lipid (sub)classes were identified in the different C. glutamicum strains analyzed (WT, ΔtmaT, and the ΔtmaT complementation strain) and in the pooled biological quality control (PBQC); 108 were DAG-based and 125 MA-based lipids. The chemical structures of trehalose-containing MAs are shown.

