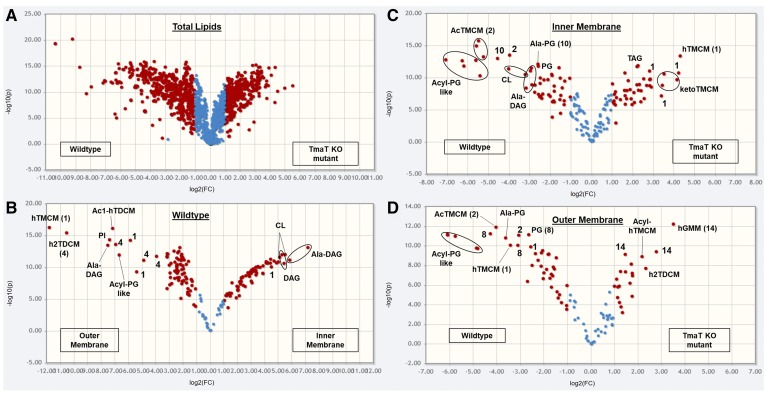
Fig. 5.
Comparison of total, IM and OM lipid composition of C. glutamicum WT versus the Δtmat mutant. Volcano plots of TLs (A), WT IM and OM lipids (B), WT versus ΔtmaT IM lipids (C), and WT versus ΔtmaT OM lipids (D). The x axis represents the fold change (threshold of 1) and the y axis the t-test (threshold of 0.05). Both values are median-normalized and log-transformed. The most highly enriched lipids of the IM of the WT (compared with its OM) were Ala-DAG, DAG, CL, PG, ketoTMCM, Gl-A to GLZ, and PIM2 to AcPIM2-4.

