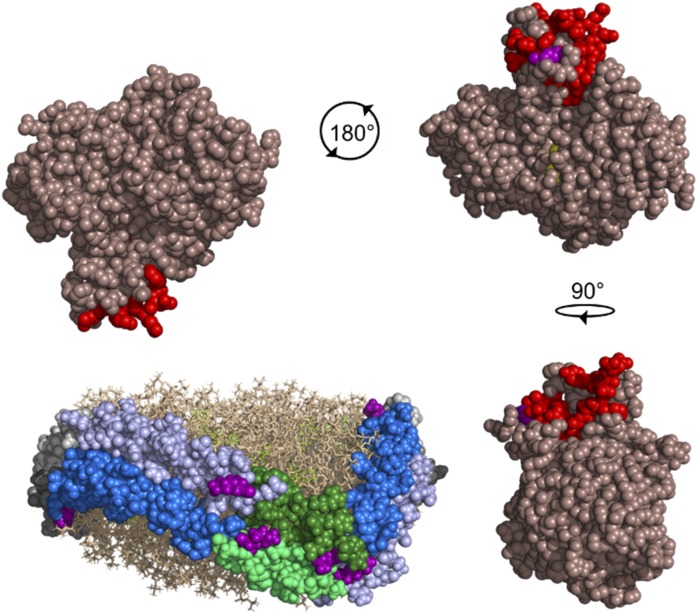
Fig. 8.
Postulated model of LCAT interacting with the 6/4 region of APOA1 molecules in the 5/5 helical registry. The Piper et al. (48) crystal structure of LCAT (dark salmon) is shown with the lid region highlighted in red and the catalytic triad in yellow. LCAT residue S108 (purple) involved in a cross-link to APOA1 is visible near the lid region. The rHDL particle is depicted with two anti-parallel molecules of APOA1 (molecule A, light gray; molecule B, dark gray) with helix (H)6 (blue), H4 (light blue), and H5 (molecule A, dark green; molecule B, light green) highlighted on both molecules. Phospholipids (tan) and cholesterol (yellow-green) are shown. Residues (purple) cross-linked in helices 4, 5, and 7 of APOA1 to LCAT are shown. In a 5/5 helical registry, there are two locations where helices 6 and 4 are opposing, meaning two possible sites for LCAT activation to occur. LCAT is depicted rotating 180° and 90° from the starting location to interact with H6 on molecule B and H4 on molecule A, and H6 on molecule A and H4 on molecule B, respectively. The figure was generated with PyMOL, version 2.0, Schrodinger, LLC.

