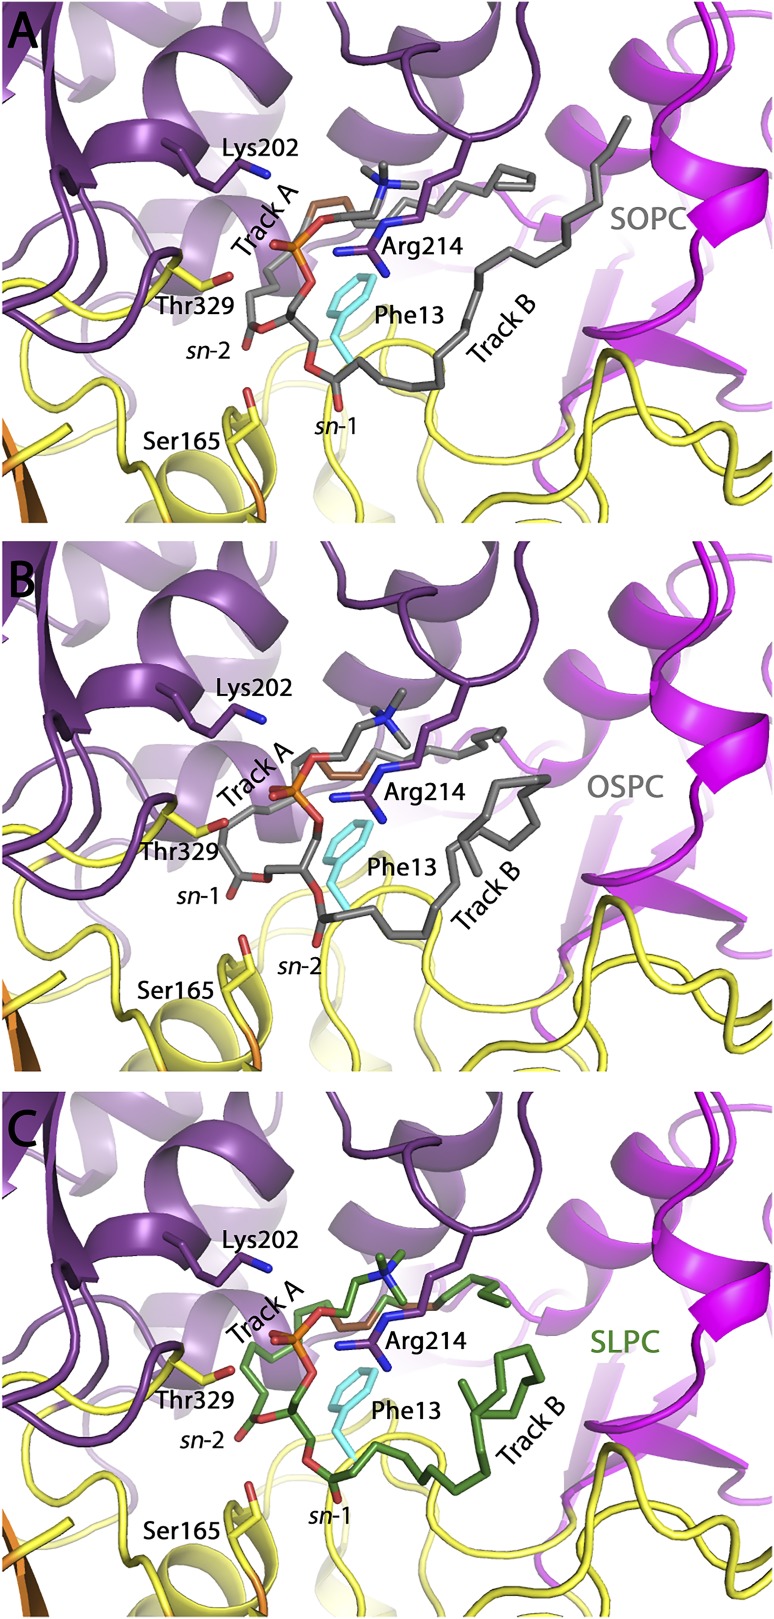
Fig. 8.
A: Overall fold of LPLA2 showing the α/β hydrolase (yellow with orange β-sheets), membrane binding (magenta), and cap (purple) domains. SOPC (gray carbons) is shown with track A occupied by the sn-2 chain and the cis double bond in black. B: Docking of SOPC and OSPC into a model of LPLA2 D13F. OSPC (gray carbons) is shown with track A occupied by the sn-1 chain. The cis double bond of the lipid tail is shown in brown. The sidechain of Phe13 is shown in cyan. C: Docking of SLPC into a model of LPLA2 D13F. SLPC (green carbons) is shown with track A occupiesd by the sn-2 chain. The cis double bonds of the lipid tail are shown in brown. The side chain of Phe13 is shown in cyan.

