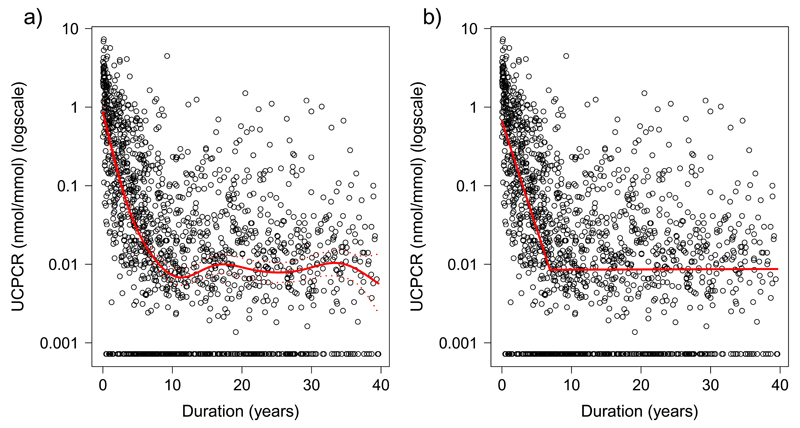
Figure 1.
Scatterplots of urinary C-peptide Creatinine Ratio (UCPCR) against duration of diabetes in 1549 individuals with Type 1 diabetes. Red lines show a) generalised additive modelling (non-linear) line of best fit, b) two straight lines of best fit meeting at the optimal breakpoint from segmented regression analysis

