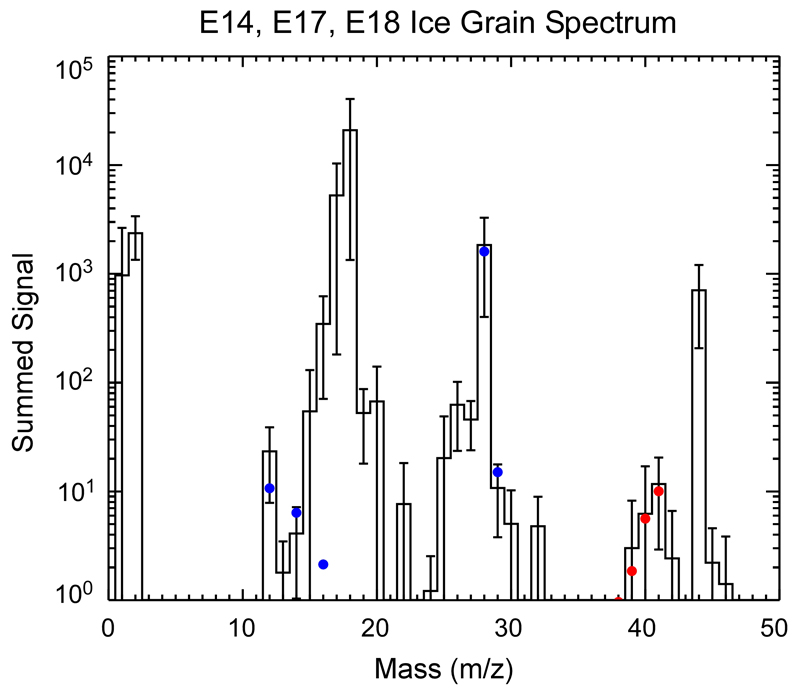
Extended Data Figure 10. Co-added INMS ice grain spike spectrum from three plume encounters.
See Methods 3b for details on how the spectrum was composed and details of its analysis. Error bars are derived from the dispersion of the count rate from the three encounters. The spectrum suggests the presence of CO fragments (blue circles) as an oxygen bearing species: N2 has very low abundance and contributes <~10% of the 28u signal. CO2 and C2H4 collectively contribute <~10% of the 28u signal. CO (blue circles) is required to fit the rest of the 28u signal and matches its other dissociative peaks well. The spectrum also indicates the presence of nitrogen-bearing species: the ‘stairstep' pattern around 41u matches best to the C2H3N spectrum (red circles). The error bars are one standard deviation, calculated from the three separate measurements of the individual encounters.

