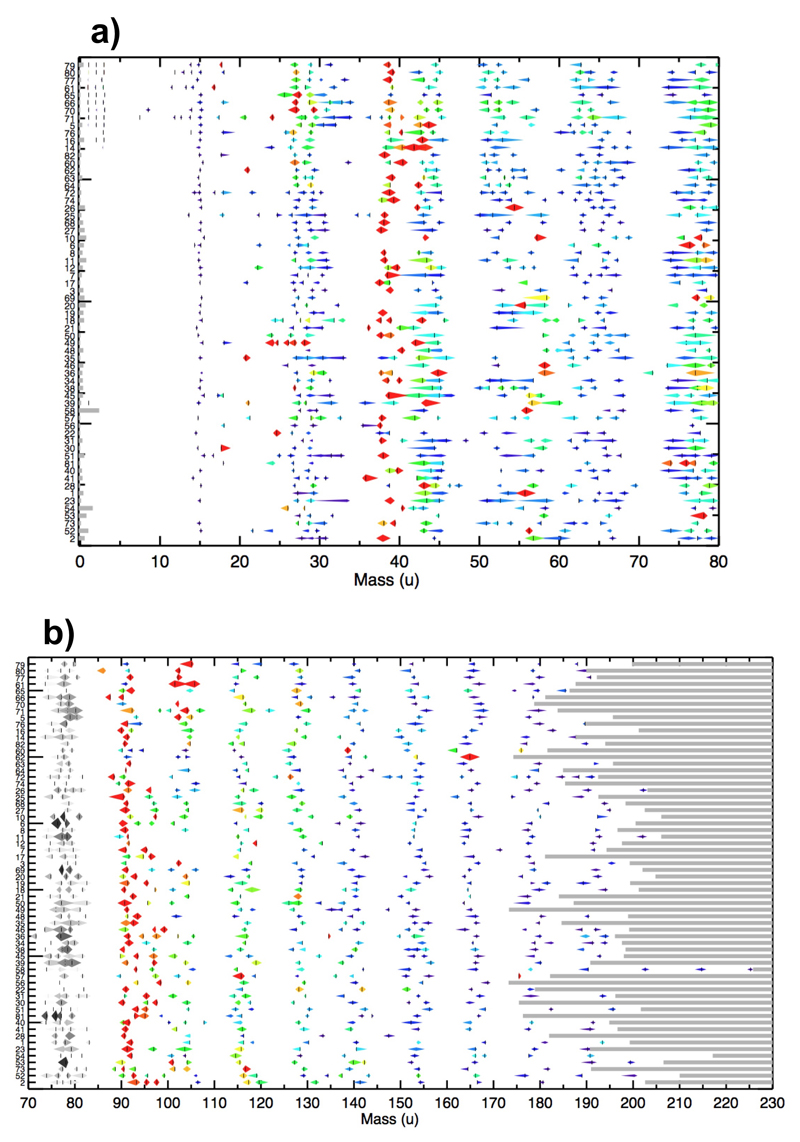
Extended Data Figure 1. semi-quantitative display of CDA HMOC spectra.
All identified organic mass lines of individual HMOC spectra. Distribution of resolved mass lines and “flank peaks” of 64 HMOC spectra with the most distinct HMOC (Methods 1d). 19 further spectra with a high level of interference with water cluster ions or low signal to noise ratio are not included here (see ED Tab. 1). All peaks depicted here are also part of the statistics shown in Figure 1 of the main paper. The spectrum number “#” (as defined in ED Table 1) is indicated to the left as an identifier of the event. The extent and the relative normalized amplitude of each spectral feature are indicated. The amplitude is given by the extension in the y-direction and the color code (red being the highest and blue the lowest amplitude). The largest horizontal diameter of the symbol marks the peak maximum. In the lower panel the amplitudes between of 70u to 85u are grey indicating that they are not to scale with the symbols shown at higher masses (they would be much larger, see Fig. 1b for comparison).
Spectra are sorted by their impact speed estimated from the orbital elements of the impinging grain, with the highest speed on top (≈ 15 km/s) and the lowest on the bottom (≈ 5 km/s). Since the exact orbital elements are unknown, each impact speed has substantial intrinsic uncertainties given in ED Tab. 1. The 12 spectra for which a minimum impact speed could be derived from the presence of hydrogen mass lines (ED Tab. 1, Methods 1d) are placed on top. The highest mass where the CDA TOF-spectrum recording ends varies between 174 u and 226 u (Methods 1a) and is indicated by the grey horizontal bars. As a consequence the frequency of the HMOC peaks around mass 178u and 191u is reduced in Figure 1b because not all individual spectra cover this mass range. The absolute masses in each individual spectrum have an intrinsic uncertainty of ±1u at 80, and ±2 u at 180 u due to the limited calibration accuracy of CDA in this high-mass regime. The mass intervals between peaks, however, are accurate to the integer level.

