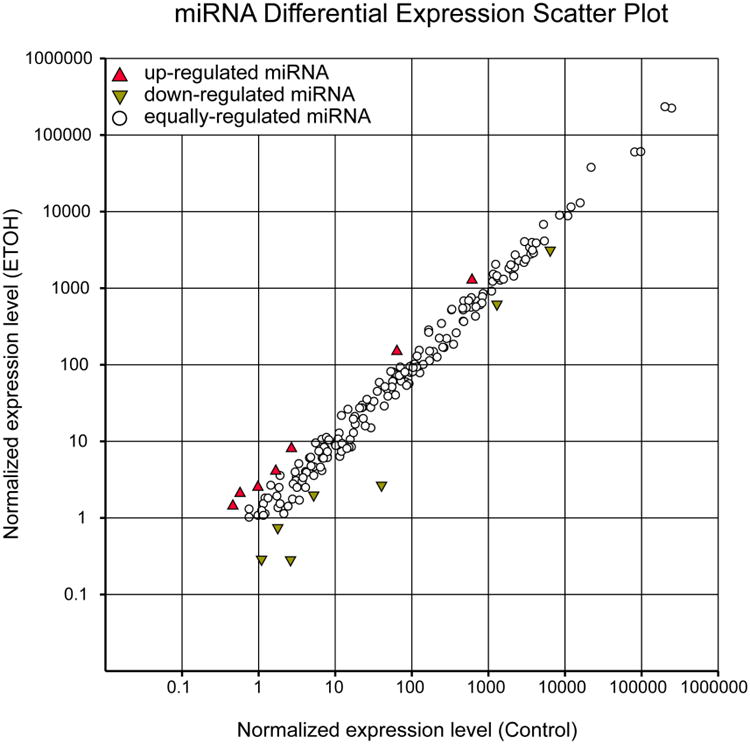
Figure 1.

Scatter plot showing a comparison of the relative abundance of the 426 known Drosophila miRNAs. The comparison is between miRNAs isolated from heads 30 minutes post ethanol sedation and miRNAs isolated from non-ethanol treated matched controls. The normalized count is reads per million [(actual count/total reads)*106]. Open circles represent miRNAs whose abundance did not differ between the two treatments. Upward-pointing triangles represent miRNAs whose abundance increases while downward-pointing triangles represent miRNAs whose abundance decreases at least two fold. Values for the relative abundances of these miRNAs are found in Supplementary Data 1.
