Figure 4.

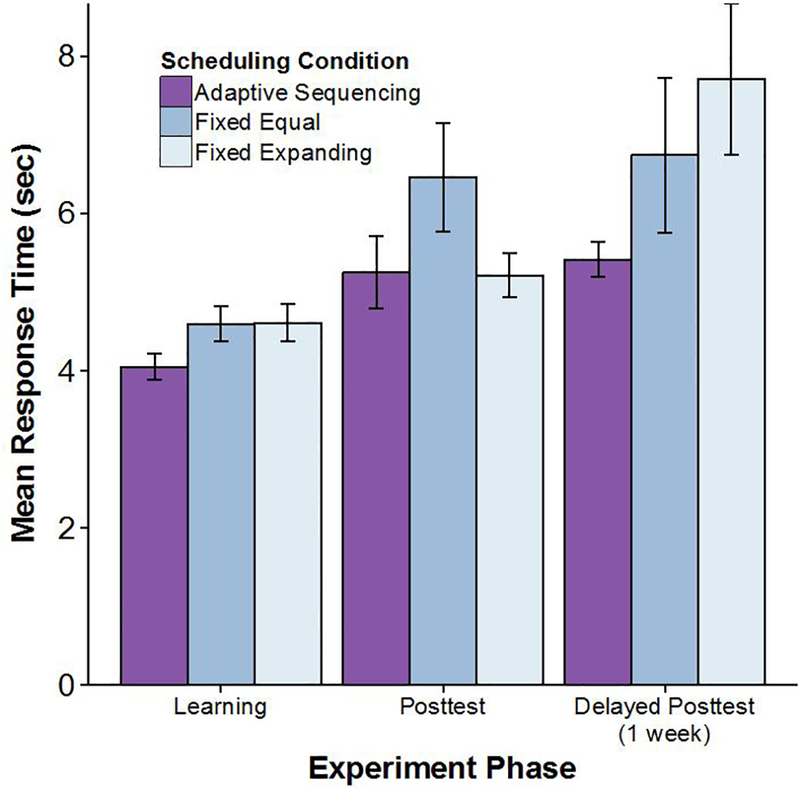
Mean response times (in seconds) at each test phase across 3 scheduling conditions in Experiment 1. Response times are from correctly answered trials only. Error bars show +/− 1 standard error of the mean.

Mean response times (in seconds) at each test phase across 3 scheduling conditions in Experiment 1. Response times are from correctly answered trials only. Error bars show +/− 1 standard error of the mean.