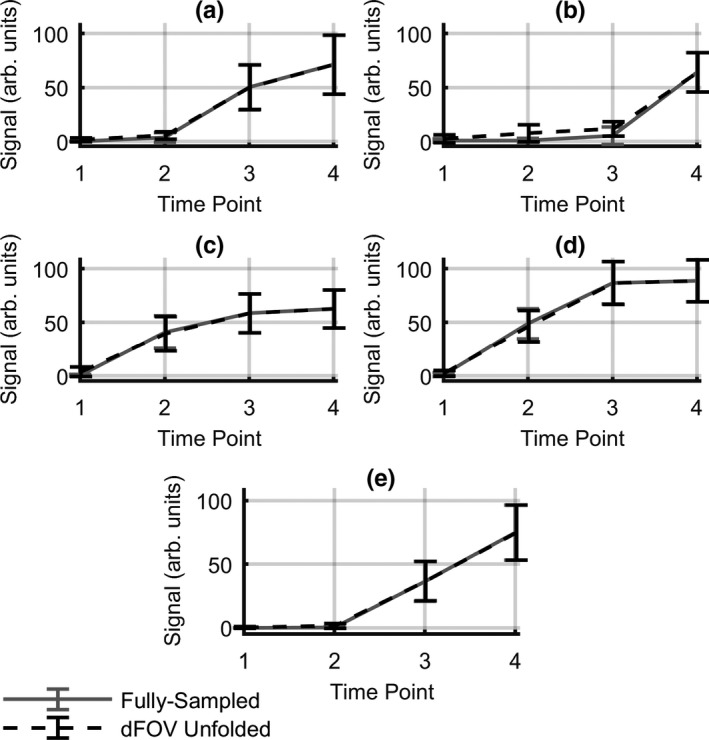
Figure 7.

Mean lesion signal enhancement versus time curves for all lesions present in the cases used in the simulation. Plots for fully sampled and dynamic FOV unfolded images are shown. This figure does not depict the entire kinetic curve, only the time‐points used in this analysis. Error bars indicate median absolute deviation in each ROI. Solid lines show mean lesion signal from full‐FOV images; dotted lines show mean lesion signal from dFOV unfolded images. Plots (a,c,d) invasive ductal carcinoma; (b) usual ductal hyperplasia; (e) fibroadenoma.
