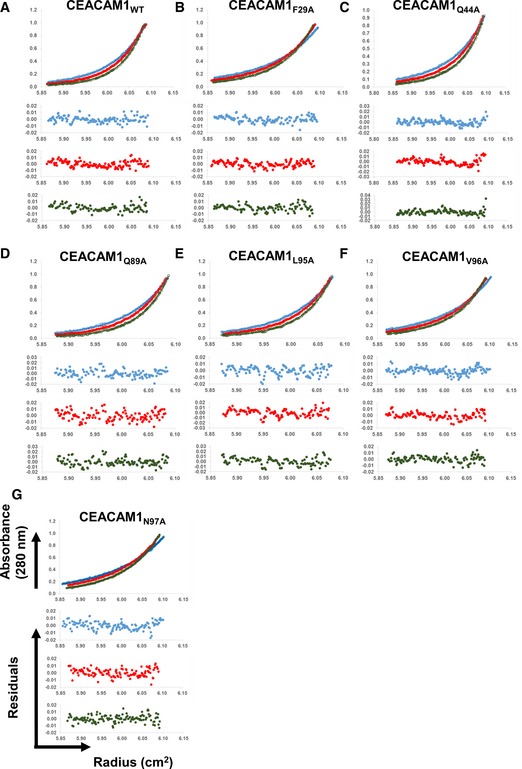
Figure EV1. Alanine scan of the CEACAM1 dimerization interface.

-
A–GSedimentation equilibrium analyses (Upper) and residuals of the fits for each curve (Lower) for (A) CEACAM1WT, (B) CEACAM1F29A, (C) CEACAM1Q44A, (D) CEACAM1Q89A, (E) CEACAM1L95AA, (F) CEACAM1V96A, and (G) CEACAM1N97A.
