-
A
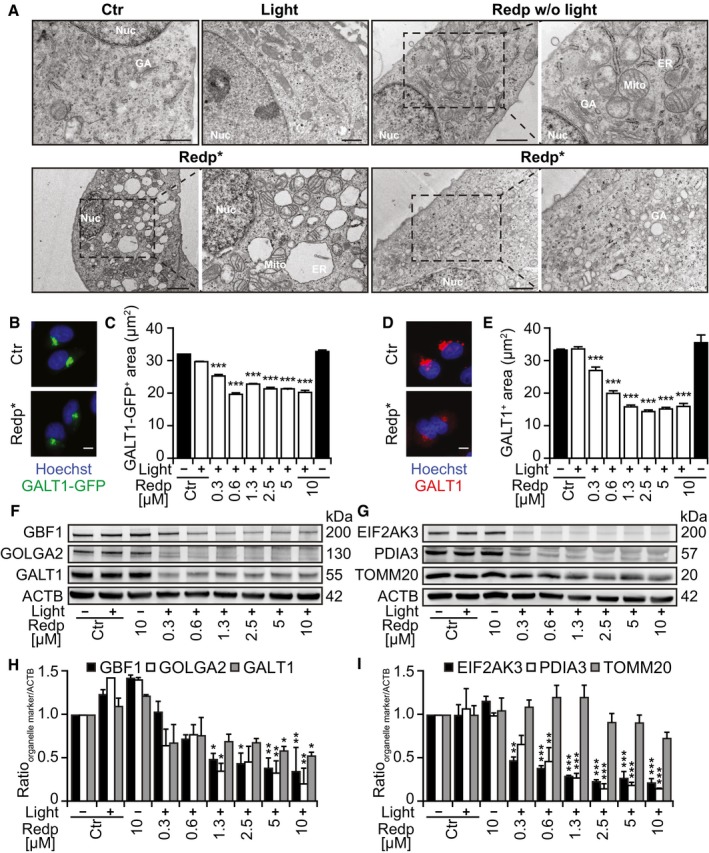
Representative images of U2OS cells analyzed 6 h after redaporfin‐PDT by transmission electron microscopy. Additional negative controls included cells incubated with redaporfin (5 μM) without photoactivation or cells submitted to light irradiation in the absence of redaporfin. Nuc marks nucleus, ER marks endoplasmic reticulum, GA marks Golgi apparatus, and Mito marks mitochondria. Scale bar: 1 μm
-
B–E
Representative images of U2OS‐GALT1‐GFP (B) and U2OS stained for GALT1 (D) 6 h after PDT with redaporfin (5 μM). Quantitative analysis represents the average area of GALT1+ Golgi structures per cell (C, E). Scale bars: 10 μm.
-
F–I
Six hours after treatment of U2OS cells with PDT with redaporfin (5 μM), protein was collected and tested by immunoblotting for different GA‐, ER‐, or mitochondria‐specific proteins. Representative immunoblots (F, G) and densitometry data (H, I) are depicted.
Data information: Ctr represents untreated cells and Redp* indicates irradiated cells. Bars indicate means ± SEM of three independent experiments. Asterisks indicate significant differences with respect to untreated cells, *
P < 0.05, **
P < 0.01, ***
P < 0.001 (one‐way ANOVA).

