-
A, B
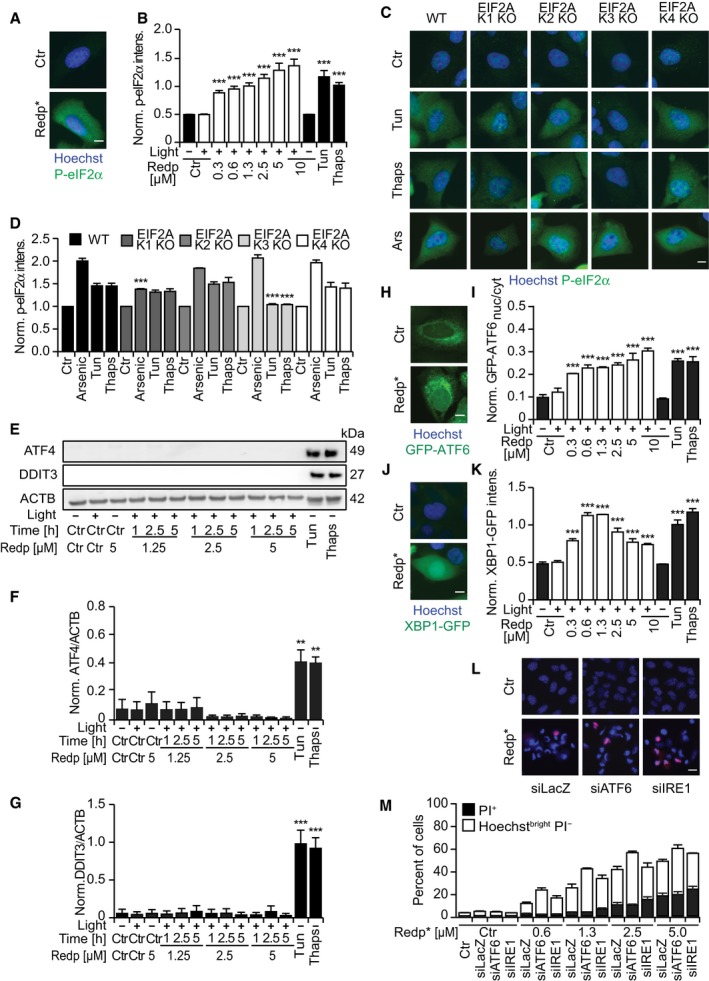
Representative images of U2OS cells stained for P‐eIF2α 2.5 h after PDT with redaporfin (5 μM) or after 6 h of incubation with tunicamycin (2.5 μM) and thapsigargin (2.5 μM) (A), and its quantitative analysis that represents cytoplasmic P‐eIF2α fluorescence signal (B). Scale bar: 10 μm.
-
C, D
Representative images of P‐eIF2α immunofluorescence in U2OS cells wild‐type or KO for each eIF2α kinase after incubation with tunicamycin (2.5 μM, 6 h), thapsigargin (2.5 μM, 6 h), or arsenite trioxide (1 mM, 2 h) (C), and its quantitative analysis that represents cytoplasmic P‐eIF2α fluorescence signal (D). Scale bar: 10 μm.
-
E–G
Representative immunoblots (E) and densitometry of ATF4 (F) and CHOP (G) of protein extracts collected from U2OS cells at the indicated time points after redaporfin‐PDT or after 12 h of incubation with tunicamycin (2.5 μM) or thapsigargin (2.5 μM).
-
H, I
Representative images of U2OS cells expressing GFP‐ATF6 8 h after PDT with redaporfin (5 μM), tunicamycin (2.5 μM), and thapsigargin (2.5 μM) (H), and the quantitative analysis that reflects ATF6 translocation from the cytoplasm into the nucleus (I). Scale bar: 10 μm.
-
J, K
Representative images of U2OS cells expressing XBP1‐GFP 20 h after PDT with redaporfin (5 μM), tunicamycin (2.5 μM), and thapsigargin (2.5 μM) (J), and quantitative analysis of XBP1 de novo expression based on cellular fluorescence (K). Scale bar: 10 μm.
-
L, M
Impact of ATF6 and IRE1 silencing on the cytotoxicity of PDT with redaporfin (5 μM), which was evaluated at 6 h post‐irradiation by double staining with PI and Hoechst 33342 (L) and the quantification of dying (Hoechstbright and PI−) and dead cells (PI+ cells) (M). Scale bar: 20 μm.
Data information: Ctr indicates untreated cells and Redp* indicates irradiated cells. Data are indicated as means ± SD of triplicates of one representative experiment out of 2–4 repeats in panels (B), (D), (I), (K), and (M) and as means ± SEM of two independent experiments in panels (F) and (G). Asterisks indicate significant differences with respect to untreated cells, **
< 0.001 (one‐way ANOVA).

