-
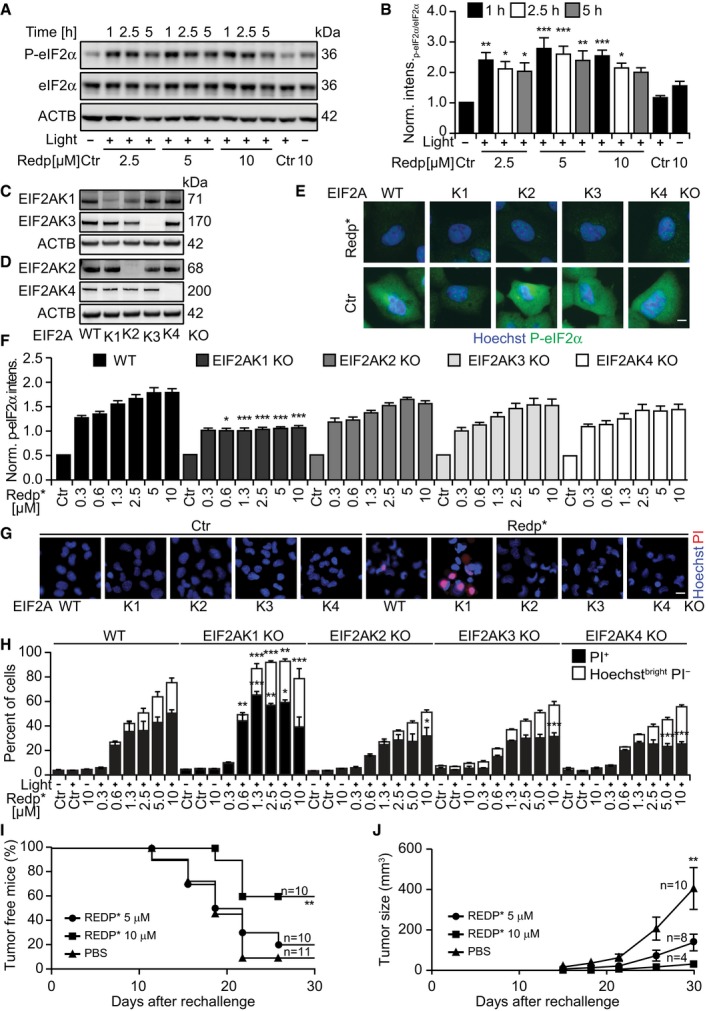
A, B
Representative immunoblot (A) and densitometry (means ± SEM of four independent experiments) of P‐eIF2α/eIF2α ratio (B) of cells collected at the indicated time points after redaporfin‐PDT.
-
C, D
Immunoblots of U2OS cells KO for each of the eIF2α kinases: EIF2AK1 (C), EIF2AK2 (D), EIF2AK3 (C), and EIF2AK4 (D).
-
E, F
Representative images of P‐eIF2α immunofluorescence in U2OS cells wild‐type or KO for each eIF2α kinase obtained 2.5 h after PDT with redaporfin (5 μM) (E) and quantitative analysis that represents cytoplasmic P‐eIF2α fluorescence signal (F). Scale bar: 10 μm.
-
G, H
Cytotoxicity of redaporfin‐mediated PDT in U2OS cells wild‐type or KO for each eIF2α kinase evaluated 6 h post‐irradiation by staining with PI and Hoechst 33342 (G) and the quantification of dying cancer cells (Hoechstbright and PI−) and dead cells (PI+ cells) (H). Scale bar: 20 μm.
-
I, J
Immunogenicity of TC1 cells killed in vitro by redaporfin‐mediated PDT. Dead/dying TC1 cells were injected subcutaneously into immunocompetent mice followed by rechallenge with live/untreated TC1 cells one week later. Graphs report the evolution of tumor incidence over time as a Kaplan–Meier curve (I) and tumor growth in those mice that developed palpable neoplastic lesion (J).
Data information: Ctr represents untreated cells and Redp* indicates irradiated cells. Bars indicate means ± SEM of 2–4 independent experiments Asterisks indicate significant differences with respect to untreated cells, *
P < 0.05, **
P < 0.01, ***
P < 0.001 (one‐way ANOVA). One‐way ANOVA was used in panels (B), (F), and (H). Vaccination experiments in panels (I) and (J) were analyzed by means of the log‐rank test (log‐rank (Mantel–Cox) test). Scale bars: 10 μm.

