-
A, B
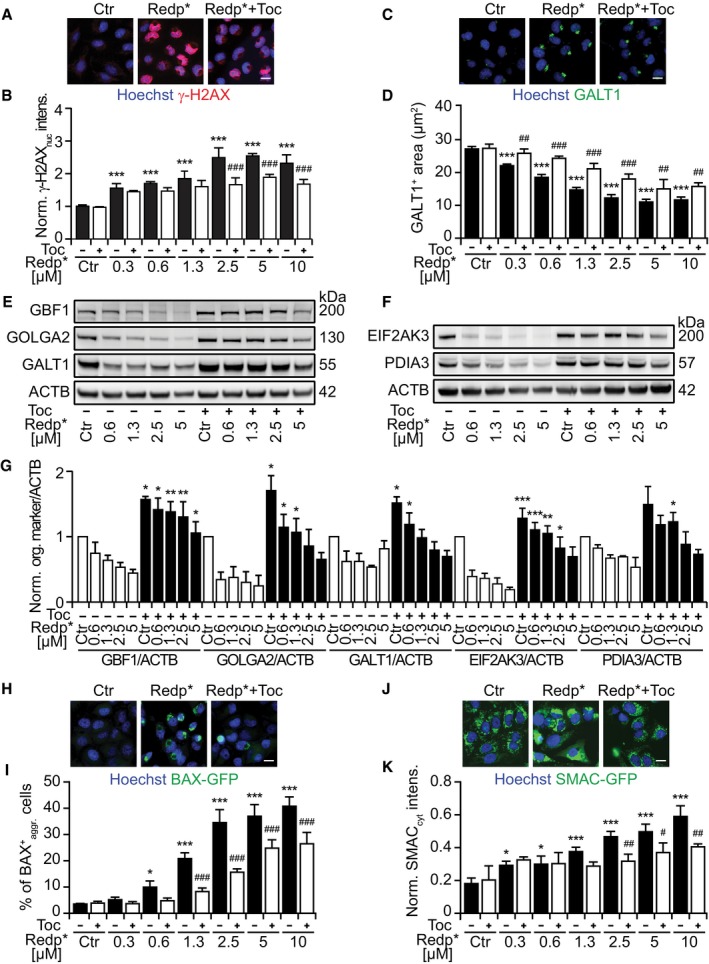
Representative images of U2OS cells stained for histone H2AX phosphorylation (γ‐H2AX), 6 h after PDT with redaporfin (5 μM), in the presence or absence of tocopherol (Toc; 500 μM) (A), and quantitative analysis based on the γ‐H2AX fluorescence in the nucleus (B).
-
C, D
Representative images of U2OS cells, stained for GALT1 6 h after PDT with redaporfin (5 μM), in the presence or absence of Toc (500 μM) (C), together with the quantitative analysis that reflects the average area of GALT1+ Golgi structures per cell (D).
-
E–G
Immunoblots and densitometry analysis for different GA (E, G) and ER proteins (F, G) of U2OS cells that were co‐incubated with redaporfin and Toc (1 mM) for 20 h. Protein extraction was performed 6 h after irradiation.
-
H, I
Representative images of BAX‐GFP aggregation at mitochondria after PDT with redaporfin (5 μM), in the presence or absence of Toc (500 μM), 6 h after irradiation (H) alongside the percentage of cells presenting BAX‐GFP aggregation (I). Scale bar: 20 μm.
-
J, K
Representative images of SMAC‐GFP release from mitochondria into the cytosol 6 h after PDT with redaporfin (5 μM), in the presence or absence of Toc (500 μM) (J). The increase in GFP in the cytoplasm, excluding the fluorescence intensity of mitochondria, was quantified and used as an indication of SMAC release (K).
Data information: Ctr represents untreated cells and Redp* indicates irradiated cells. Analysis of fluorescence microscopy is represented by bars that indicate means ± SD of triplicates of one representative experiment out of 2–4 repeats, whereas densitometry data are represented by bars that indicate means ± SEM of four independent experiments. Asterisks indicate significant differences with respect to untreated cells, whereas hashes indicate significant differences for redaporfin‐PDT in the presence or absence of Toc, *
P < 0.05, **
P < 0.01, ***
P < 0.001.
#
P < 0.05,
##
P < 0.01,
###
P < 0.001 (two‐way ANOVA). Scale bars: 20 μm.

