
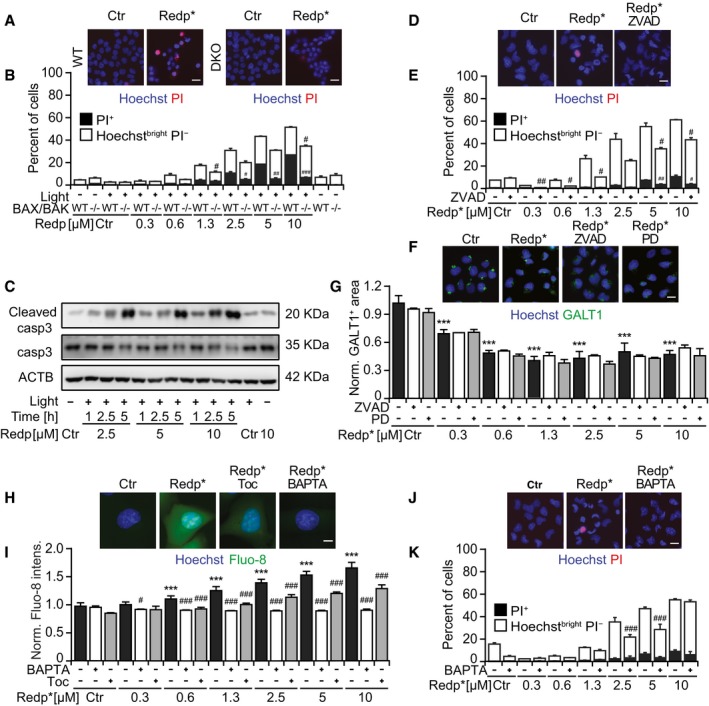
Figure EV4. Reduced cytotoxicity of redaporfin‐PDT in the presence of the antioxidant Toc, the pan‐caspase inhibitor ZVAD, the calcium chelator BAPTA, and BAX/BAK knockout.
-
A, BViability of HCT116 and HCT116 BAX−/−BAK−/− cells after treatment with redaporfin‐based PDT. Scale bar: 20 μm.
-
CRepresentative immunoblot of cleaved caspase‐3 in TC1 cells collected at the indicated time points after redaporfin‐PDT.
-
D, EViability of U2OS cells after treatment with redaporfin‐PDT, in the presence of Z‐VAD‐fmk (ZVAD; 50 μM). Scale bar: 20 μm.
-
F, GRepresentative images of U2OS cells stained for GALT1, 6 h after PDT with redaporfin (5 μM), in the presence or absence of ZVAD (50 μM) or PD150606 (40 μM) (C), and the analysis that reflects the average area of GALT1+ Golgi structures per cell (D). Scale bar: 20 μm.
-
H, IRepresentative images of calcium release evaluated by means of Fluo‐8‐AM in U2OS cells incubated with redaporfin (5 μM) for 20 h, with an additional incubation of 4 h with Toc (250 μM) or BAPTA‐AM (5 μM) (H), and its quantification based on Fluo‐8‐AM fluorescence (I). Scale bar: 10 μm.
-
J, KViability of U2OS cells after treatment with redaporfin‐PDT, in the presence of BAPTA (5 μM). Scale bar: 20 μm.Viability was assessed 6 h after irradiation by staining the cells with the vital dye propidium iodide (PI) and the chromatin dye Hoechst 33342. Cell death was quantified according to phenotypic groups divided into dying (Hoechstbright PI−) and dead cells (PI+ cells).