-
A, B
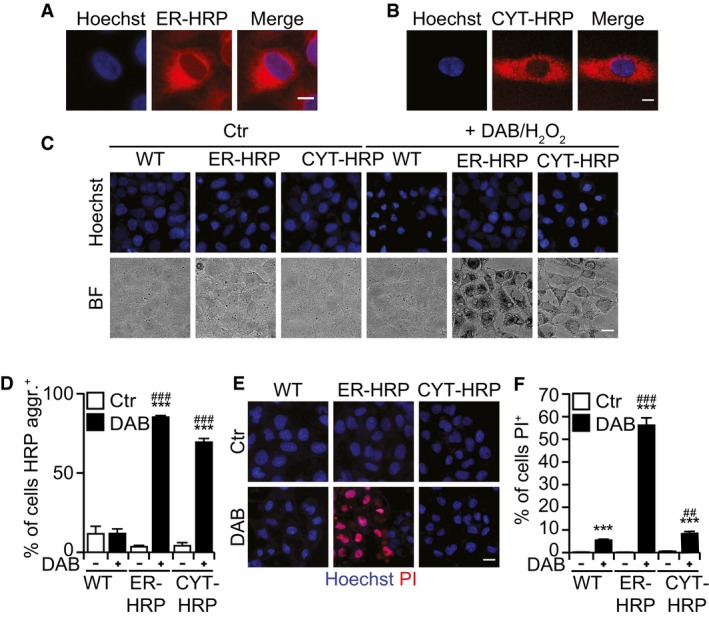
Cells that stably express HRP in the ER (A) or at cytoplasm (B). Scale bar: 10 μm.
-
C–F
DAB polymerization after treatment with DAB/H2O2 for 24 h at 37°C (C), percentage of cells with DAB aggregates (D), and quantification of dead cells (PI+ cells) (E, F). Scale bar: 20 μm.
Data information: Bars indicate means ± SD of triplicates of one representative experiment out of two repeats. Asterisks indicate significant differences with respect to untreated cells, whereas hashes indicate significant differences between WT cells and HRP‐expressing cells, ***
P < 0.001,
##
P < 0.01,
###
P < 0.001 (two‐way ANOVA).

