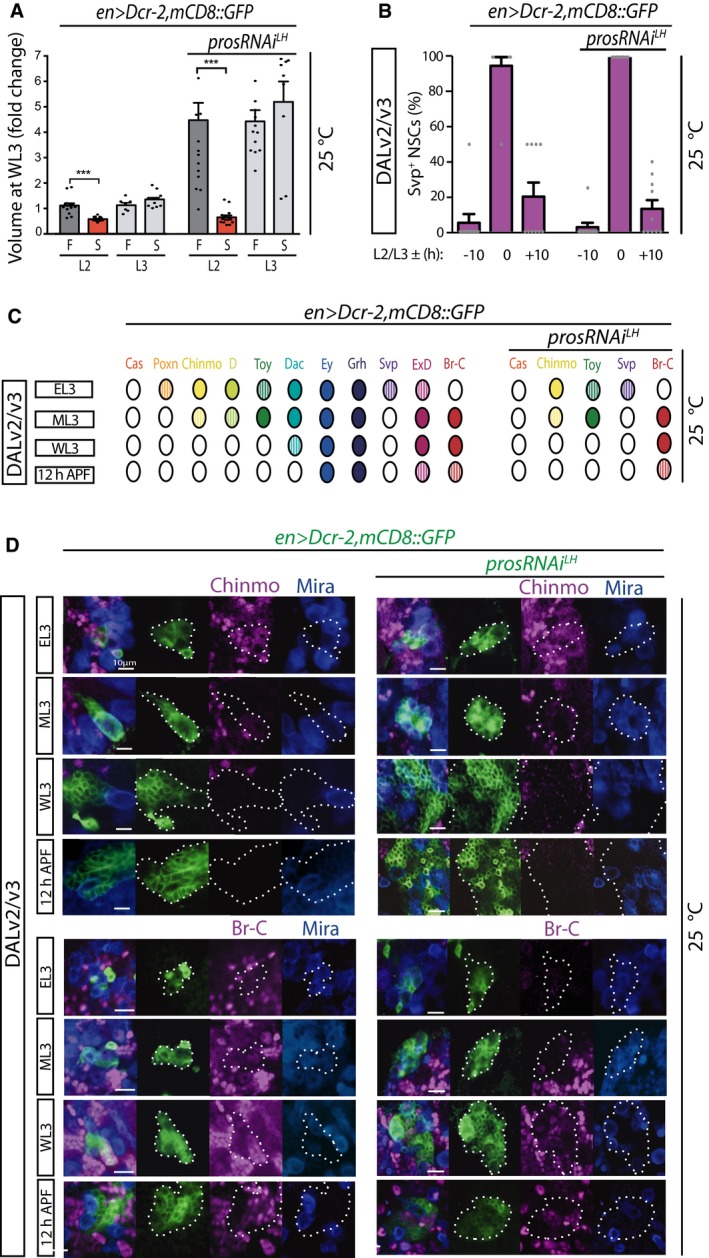
Figure 3. Non‐tumorigenic supernumerary DAL NSCs display temporal properties of original NSCs.

- Volume at WL3 stage (fold‐change relative to mean value of WT lineages in animals fed from late L2 stage: first histogram) of DAL lineages of animals that were split at the L2/L3 molt into late L2 or EL3 and then either fed (F) or starved (S) thereon; histograms represent the mean (n = 7–16 CNSs; details in source data) and error bars SEM. Red bars indicate mean statistically significantly different from control; ***P < 0.001 unpaired t‐test.
- Percentage of Svp+ cells in WT and expanded DAL lineages at timepoints centered on the L2/L3 molt (10 h before, at the molt, and 10 h after); histograms represent the mean (n = 10 CNSs; details in source data) and error bars SEM.
- Schematic representation of expression time course in WT and expanded DAL lineages of a number of transcription factors in DAL lineage NSCs; hatched color represents lower levels than full color.
- Pictures of expression time course in WT and expanded DAL lineages of the temporal markers Chinmo and Br‐C (single optical sections; lineages outlined with dotted lines in split green, magenta and blue channels); co‐stained for Mira allows identification of the NSCs.
