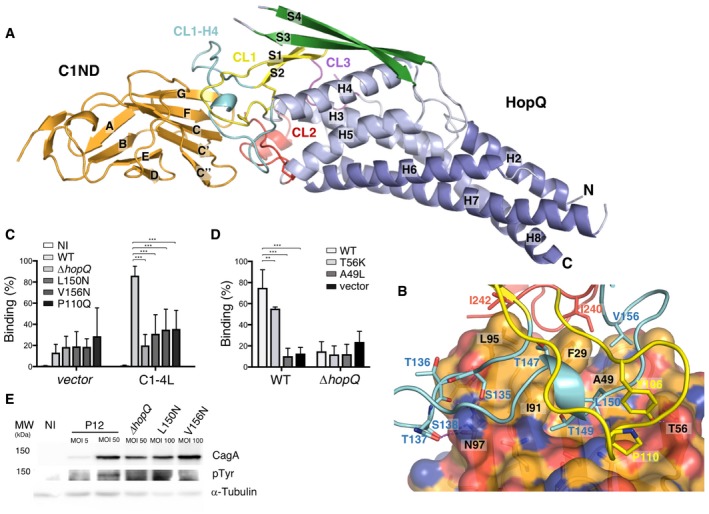
Figure 1. Structure of HopQAD ‐I bound to the N‐terminal domain of CEACAM1.

- Ribbon representation of the N‐terminal domain of CEACAM1 (C1ND; orange) bound to type I HopQ adhesin domain (HopQAD‐I). The adhesin binds the GFCC'C’’ sheet of its immunoglobulin‐like fold. HopQAD‐I shows the conserved 3 + 4‐helix bundle topology (α‐helices colored in light blue and blue) with three Cys‐bound loops CL1 (Cys102–Cys131), CL2 (Cys237–Cys269) and CL3 (Cys361–Cys384) colored in yellow, red, and purple, respectively. In the complex, the flexible CL1‐H4 loop (colored cyan) becomes structured upon C1ND binding. The β‐strands of the HopQAD‐I insertion domain are colored in green.
- Close‐up of the interaction surface between C1ND (ribbon and transparent surface representation) with HopQAD‐I (ribbon representation). Coloring scheme as in (A); carbon, nitrogen, and oxygen atoms of C1ND are, respectively, in orange, blue, and red. Interacting residues of HopQAD‐I and C1ND are depicted as stick model and named (residues in C1ND are labeled in black).
- Binding of H. pylori P12 wild‐type and HopQ mutants to MKN28 cells transfected with full‐length CEACAM1 (CC1‐4L) or empty vector. n = 3. Error bars = SD. Two‐way ANOVA with Bonferroni post‐test. ***P < 0.001.
- Binding of H. pylori P12 wild‐type and ∆hopQ to CHO cells transfected with CC1‐4L, CC1‐4L mutants or empty vector. n = 4. Error bars = SD. Two‐way ANOVA with Bonferroni post‐test. **P < 0.01. ***P < 0.001.
- Western blots of phospho‐Tyr, CagA, and loading control alpha‐tubulin in MKN28 CEACAM1‐4L cells infected at indicated multiplicity of infection (MOI) for 6 h with the wild‐type P12 or P12 ∆hopQ complemented with indicated HopQ point mutants. CagA translocation is indicated by the appearance of a phosphorylated product running just below 150 kDa.
Source data are available online for this figure.
