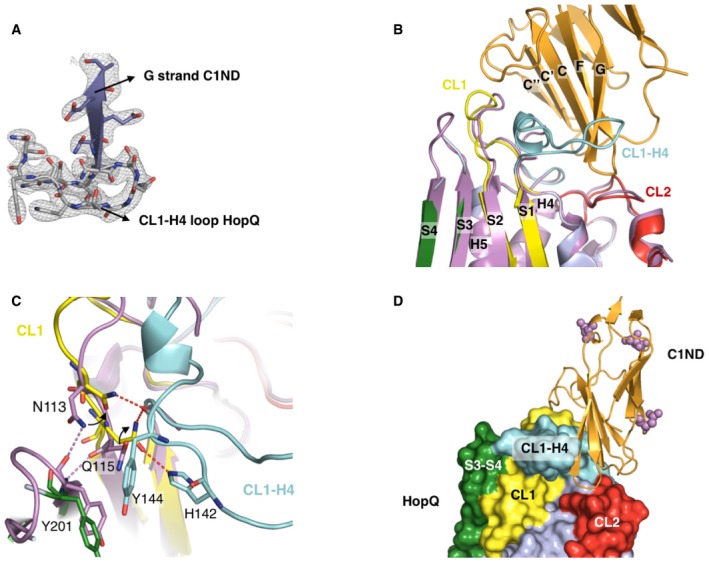
Figure EV1. The CL1‐H4 loop of HopQAD ‐I becomes structured upon C1ND binding.

- Electron density map contoured at 1.2 σ around the interaction interface of the HopQAD‐I‐C1ND complex. The G strand of C1ND and the CL1‐H4 loop of HopQAD‐I are depicted.
- Comparison of the apo (purple) and C1ND (light blue; C1ND in orange) bound structures of HopQAD‐I. The CL1‐H4 loop is partially unstructured in the apo structure with no observable electron density.
- Overview on the structural rearrangements occurring around the CL1‐H4 loop between apo and C1ND bound HopQAD‐I. Upon C1ND binding, the CL2‐H4 loop becomes ordered and Asn113 and Gln115 reorganize to interact with the CL2‐H4 loop. Hydrogen bonds depicted by dashed lines.
- Overview on the HopQAD‐I‐C1ND complex with potential C1ND N‐glycosylation sites depicted by purple spheres.
