
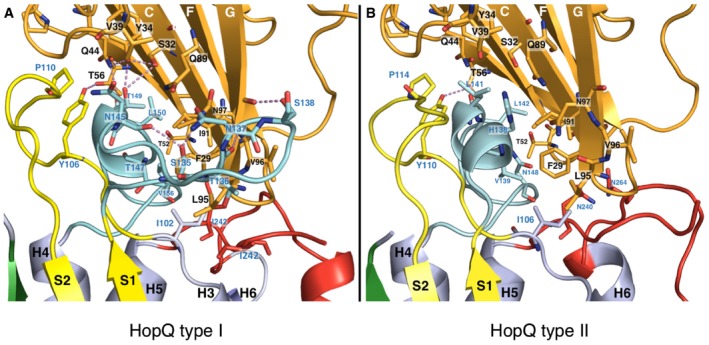
Figure EV2. Comparison of C1ND interacting with either HopQAD ‐I or HopQAD ‐ II .
-
A, BClose‐up on the formed interactions between HopQAD‐I and C1ND (A) and HopQAD‐II and C1ND (B). Interacting residues are shown in stick model and indicated (blue for HopQ residues, black for C1ND residues) with oxygen and nitrogen atoms, respectively, colored in red and blue. C1ND is colored in orange, CL1 in yellow, CL2 in red, and CL1‐H4 in cyan.