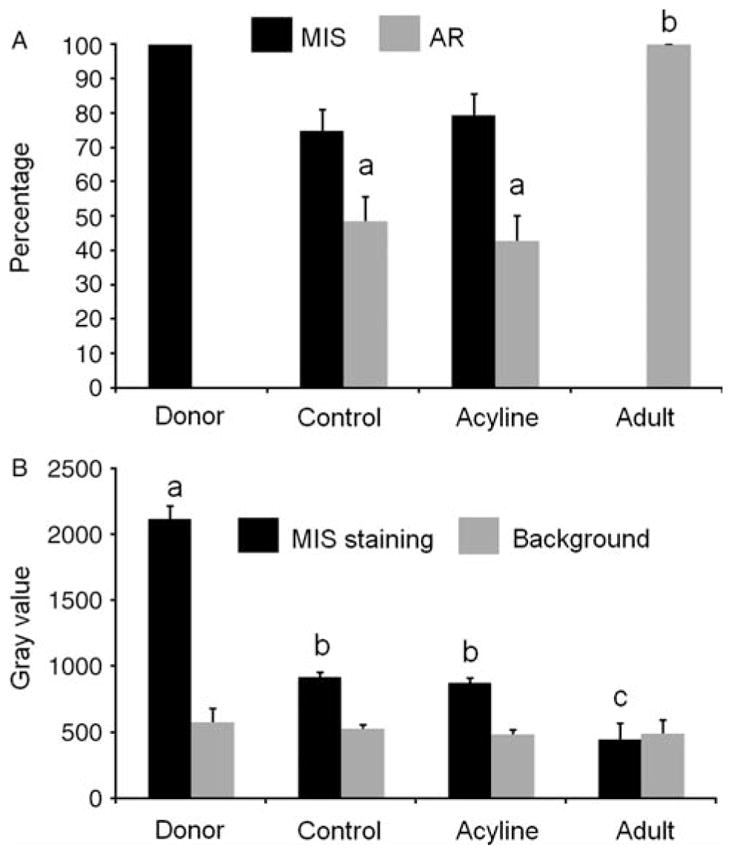
Figure 4.

Percentage of seminiferous cord and tubule cross sections containing Müllerian inhibiting substance (MIS)- and androgen receptor-positive cells (A) and densitometry analysis of MIS expression in cords and tubules in donors testis and testis xenografts (B) of the acyline experiment. As adult control tissue was negative for MIS, note that in (B) in the adult sample the black bar represents the background staining of the seminiferous epithelium, while the gray bar represents only the background of the interstitial tissue. Different letters between bars of the same shade indicate significant difference (P<0.05).
