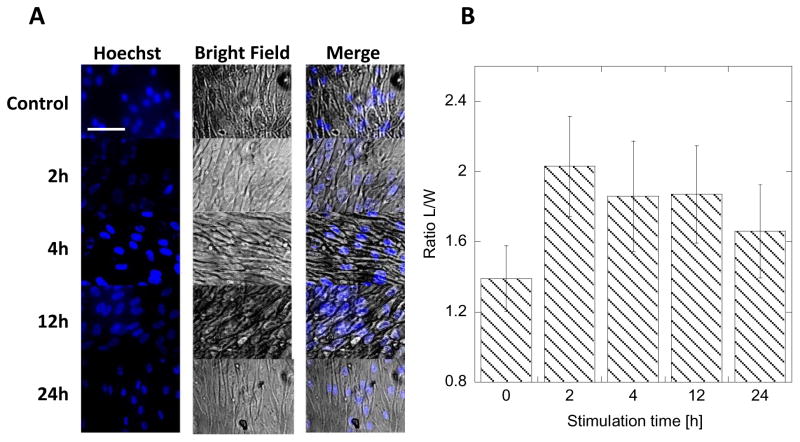
Figure 3.
Fluorescence and bright-field images of HDF stimulated with 8V biased, 1Hz, 10% duty cycle pulse for different periods of time. Bar represents 20 μm (A). The measured ratio of length-to-width (L/W) of HDF nucleus for different stimulation times in A. Error bars represent standard deviation from 20 measurements (B).

