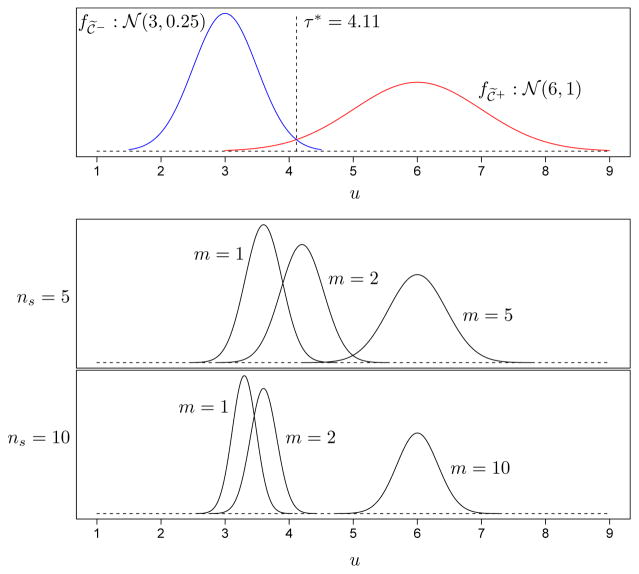
Figure 2.
Top panel: Individual biomarker densities for 𝒞̃− ~ 𝒩(3, 0.25) and 𝒞̃+ ~ 𝒩(6, 1). Under our measurement error density assumption, 𝒞|𝒞̃ ~ 𝒩(𝒞̃, 0.0025), the threshold τ* = 4.11 maximizes Youden’s index for individual testing. Middle and bottom panels: Densities of the pooled biomarker measurements, , for different m (the number of positive individuals in ℘sl) when the pool size is ns = 5 and ns = 10.

