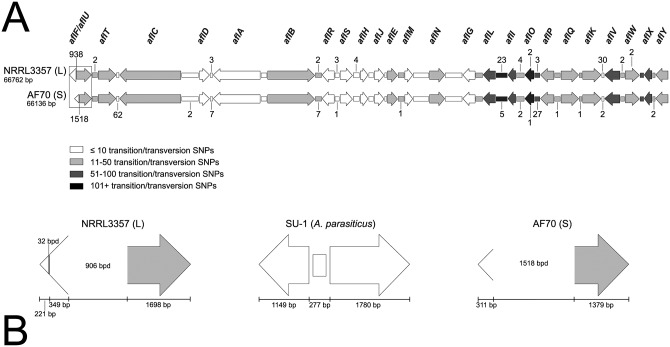
Fig 4. Schematic of the aflatoxin cluster as a comparison of polymorphisms that differentiate an A. flavus L-morphotype strain (NRRL 3357) from an A. flavus S-morphotype strain (AF70).
The genes are shown as arrows and the intergenic regions are shown as boxes (A and B). Shading for each gene and intergenic region relates to the quantity of transition and transversion SNPs observed (legend). Any number noted above or below a gene or intergenic region for panel A represents the quantity of base pair deletions (bpd) found within the NRRL 3357 or AF70 cluster sequences, respectively. The boxed aflF/aflU regions in panel A are enlarged in panel B, for which the genes in this region (for both A. flavus morphotypes) are compared to the same (complete) genomic region in the SU-1 A. parasiticus strain. Areas noted with bpd indicate large-scale deletions observed.

