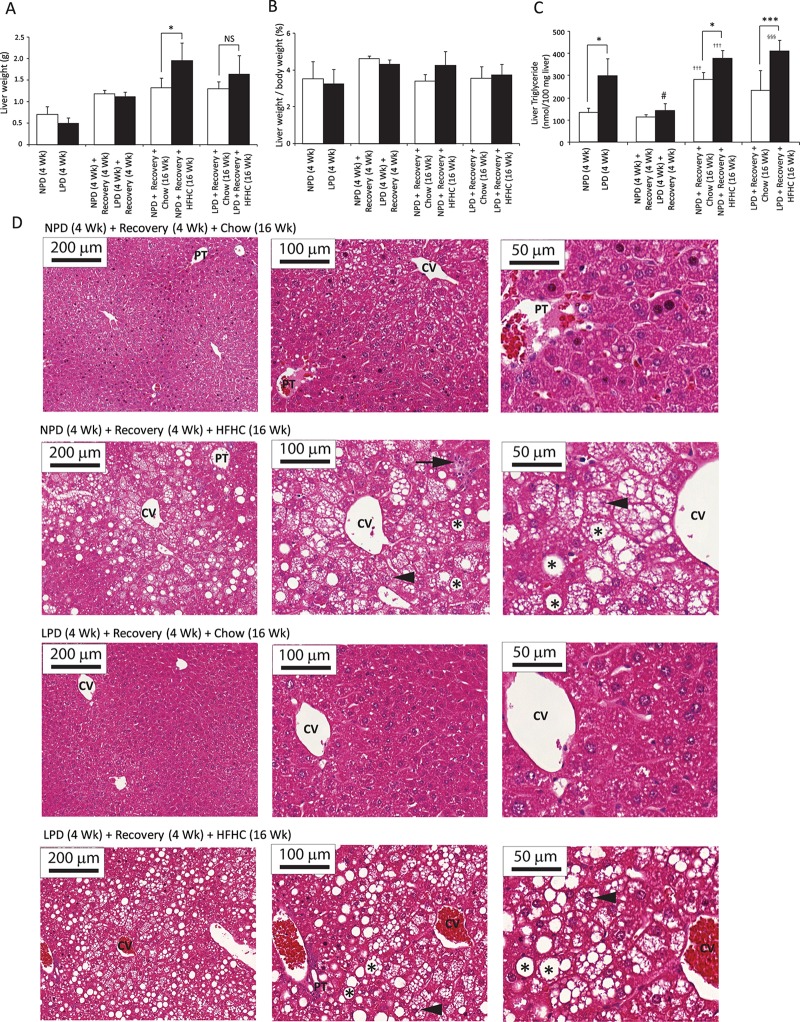
Fig 5. Assessment of liver pathology in C57BL/6 mice at the end of 4 weeks of normal protein diet (NPD, control diet) or low protein diet (LPD, malnutrition diet) feeding during the first burden/malnutrition period, 4 weeks of chow diet feeding during the recovery period, and 16 weeks of chow or HFHC diet feeding during the second burden period.
(A) Mouse livers were weighed ex vivo after each feeding period. Only the NPD/HFHC-fed mice had greater liver weights than the chow diet-fed NPD mice (All data are presented as means ± SD, n ≥ 4 mice per group; *P < 0.05, NS (not significant) P value >0.05, Tukey’s post hoc test, One-way ANOVA). (B) Mouse livers were weighed ex vivo after each feeding period. The liver-to-body weight ratio did not differ between groups (All data are presented as means ± SD, n ≥ 4 mice per group; *P < 0.05, Tukey’s post hoc test, One-way ANOVA). (C) Liver triglycerides levels were determined at sacrifice. LPD-fed mice after 4 weeks had higher triglycerides level in liver than the NPD-fed mice, and the NPD/HFHC-fed as well as LPD/HFHC-fed mice had higher triglycerides levels than the corresponding chow diet-fed control groups. The liver triglyceride levels in the LPD-fed mice were significantly decreased post-recovery as compared with the malnutrition period (All data are presented as means ± SD, n ≥ 4 mice per group, *P < 0.05, ***P<0.001, †††P < 0.001 vs. NPD-fed mice following recovery, §§§P < 0.001 vs. LPD-fed mice following recovery, #P < 0.05 vs. LPD-fed mice at the end of 4 weeks of malnutrition period, Tukey’s post hoc test, One-way ANOVA). (D) Histologic analysis. Hematoxylin-eosin staining of liver paraffin sections show normal histology in NPD-fed as well as LPD-fed mice following recovery and chow diet feeding for 16 weeks; inflammatory infiltrate (black arrow), and microvesicular (arrowhead) and macrovesicular (asterisk) steatosis were observed in NPD-fed and LPD-fed mice following recovery and HFHC diet feeding for 16 weeks; CV, central vein; PT, portal triad (magnification: X10, Bar = 200 μm; X20, Bar = 100 μm; X40, Bar = 50 μm).

