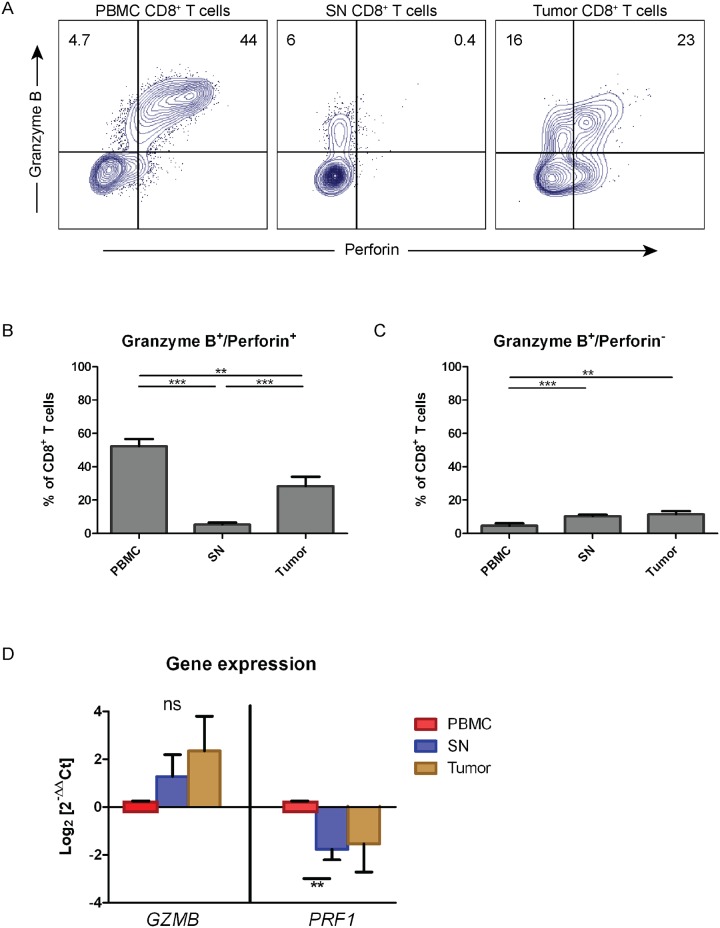
Fig 2. Perforin deficiency in CD8+ T cells from sentinel nodes.
(A) The expression of granzyme B and perforin in CD8+ T cells of different tissues were phenotyped by flow cytometry. The co-expression pattern in CD8+ T cells was shown in dot plots and gated for distinguishing between double and single expression of granzyme B and perforin. The gate was based on isotype control and the frequency of granzyme B and perforin expression was counted out of CD8+ T cells. Dot plots showed a representative data from a patient underwent transurethral resection of the bladder (TUR-B) and cystectomy. (B) The frequency of granzyme B+/perforin+ CD8+ T cells from PBMC, SN, and tumor tissues was shown in graphs and was calculated out of CD8+ T cells (n = 27). (C) Same as in (B) but the analysis was done on granzyme B+/perforin- CD8+ T cells. The data are means with the error bars indicating SEM. Kruskal-Wallis was used as the statistical test. (D) The expression of gene responsible in encoding granzyme B (GZMB) and perforin (PRF1) in CD8+ T cells isolated from PBMC, SN, and tumor (n = 6). RT-qPCR was done to analyze the gene expression followed by quantification using 2-ΔΔCt method. The fold change was calculated in regards of PBMC as control, with RPII gene used as the housekeeping gene. The data are the means of Log2 of fold change (2-ΔΔCt) with the error bars indicating SEM. Kruskal-Wallis was used as the statistical test on each gene. *p<0.05, **p<0.01, ***p<0.001, ****p<0.0001.

