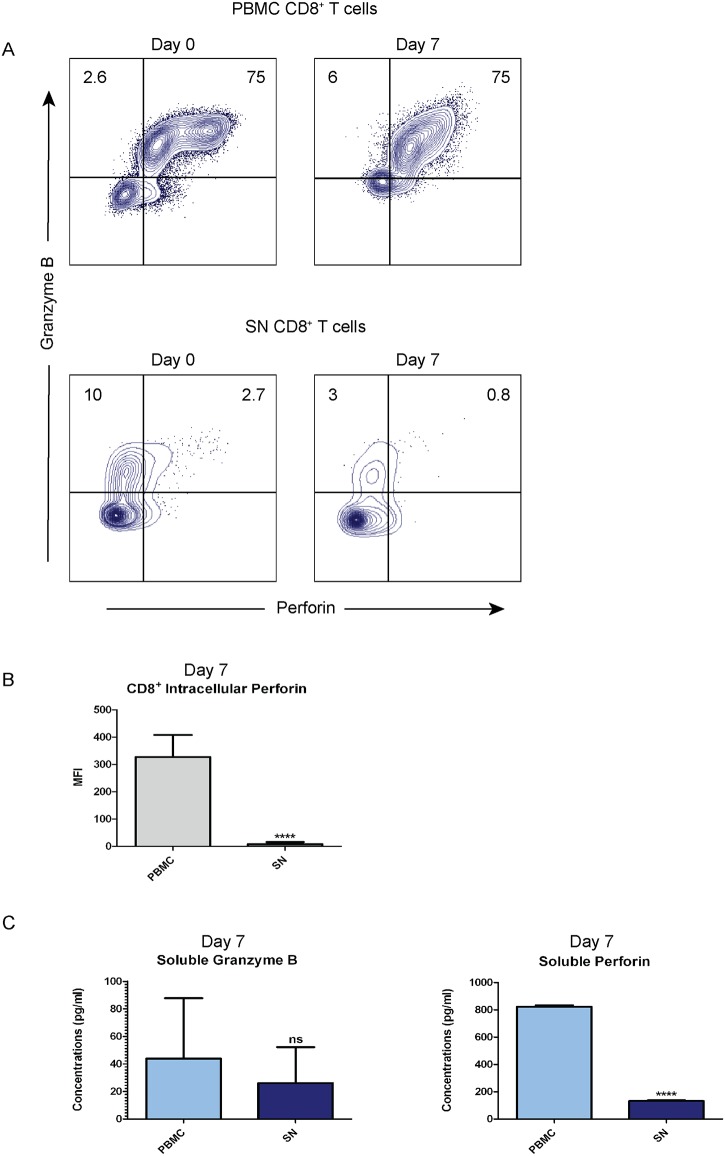
Fig 3. Production and secretion of perforin in SN CD8+ T cells are low after in vitro reactivation.
Lymphocytes isolated from peripheral blood (PBMC) and sentinel node (SN) were cultured for seven days with addition of autologous tumor homogenate. (A) Flow cytometry was done to phenotype the co-expression in CD8+ T cells from PBMC and SN before and after reactivation. The results were shown in dot plots and gated based on isotype control. The frequency of granzyme B and perforin expression was counted out of CD8+ T cells. Dot plots showed data from a representative cystectomized patient. (B) Intracellular perforin was measured by Median Fluorescence Intensity (MFI) post 7-day culture using flow cytometry from (A). The data are means with error bars indicating SEM. Mann-Whitney was used as the statistical test. (C) The concentrations (pg/ml) of secreted granzyme B and perforin after seven days of culture were analyzed by ELISA and compared between in vitro culture supernatants of PBMC and SN. The data are means with error bars indicating SEM. Mann-Whitney was used as the statistical test. *p<0.05, **p<0.01, ***p<0.001, ****p<0.0001.

