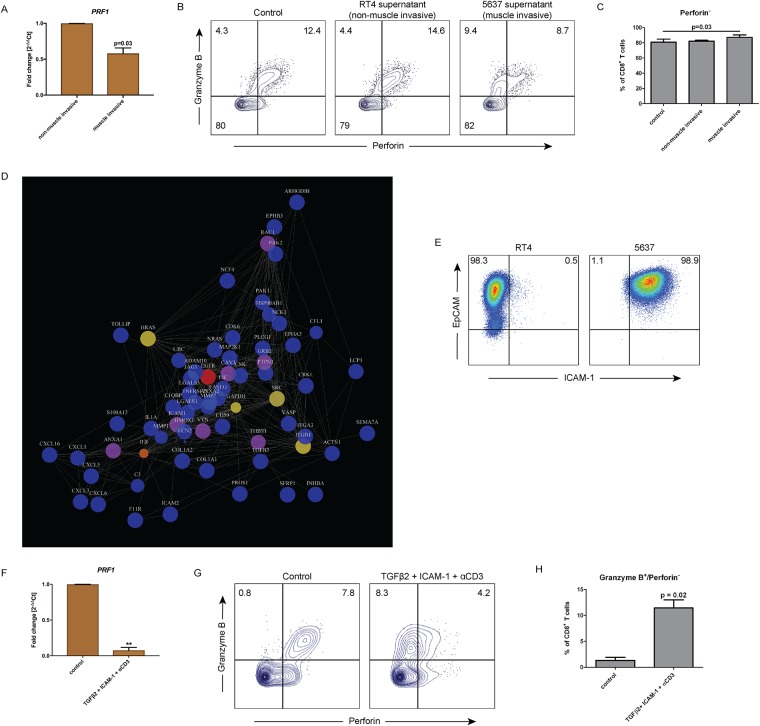
Fig 6. ICAM-1 and TGFβ2 signal from muscle invasive UBC causes perforin downregulation.
Culture supernatants of urothelial bladder cancer (UBC) cell lines were acquired from RT4 (non-muscle invasive) and 5637 (muscle invasive) cell lines. CD8+ T cells were then isolated from peripheral blood of healthy donor and cultured in vitro with these supernatants for five days. (A) Analysis of perforin coding gene (PRF1) expression was done by RT-qPCR. mRNA was extracted post-culture from the cells of the culture groups. Bar graphs show different expression of PRF1 in CD8+ T cells cultured in vitro between RT4 (non-muscle invasive) and 5637 (muscle invasive) supernatant. RPII gene was used as housekeeping gene and the fold change was calculated in regards of RT4 medium using 2-ΔΔCt method. The data are means with error bars indicating SEM. Paired-t-test was used as the statistical test. (B) Flow cytometry analysis of CD8+ T cells at the end of culture was done. The results comparing three groups were shown in dot plots from a representative healthy donor and gated based on isotype control. (C) The frequency of perforin- CD8+ T cells from (B) was counted out of CD8+ T cells. The data are means with the error bars indicating SEM. One-way repeated-measure ANOVA was used as the statistical test. (D) Mass spectometry (MS) analysis identified proteins expressed by RT4 and 5637 cell line. Proteins under the category “immune system process” on the GO (Gene Ontology) term were selected for network analysis based on STRING database. Size represented differential expression between RT4 and 5637 supernatants and the color represented betweenness which marked the influence of the protein to the network. Color indicators: blue = low, yellow = average and red = high. (E) The expression of ICAM-1 was validated by flow cytometry on RT4 and 5637 cell line. RT4 and 5637 cells were identified by EpCAM expression. (F) Validation of perforin downregulation by ICAM-1 and TGFβ2 was done in vitro on CD8+ T cells isolated from healthy donors in the presence of anti-CD3 stimulating antibody for 5 days. Perforin coding gene (PRF1) expression was done by RT-qPCR. mRNA was extracted post-culture from the cells. Bar graphs show different expression of PRF1 in CD8+ T cells cultured in vitro between control and TGFβ2 + ICAM-1 + αCD3. RPII gene was used as housekeeping gene and the fold change was calculated in regards of blank medium using 2-ΔΔCt method. The data are means with error bars indicating SEM. Paired-t-test was used as the statistical test. (G) Flow cytometry analysis of CD8+ T cells at the end of culture was done. The results were shown in dot plots and gated based on isotype control from a representative healthy donor. The frequency of granzyme B and perforin expression was counted out of CD8+ T cells. (H) The frequency of granzyme B+/perforin- expressing cells from (G) was counted out of CD8+ T cells. The data are means with error bars indicating SEM. Paired-t-test was used as the statistical test. * p<0.05, **p<0.01, ***p<0.001, ****p<0.0001.

