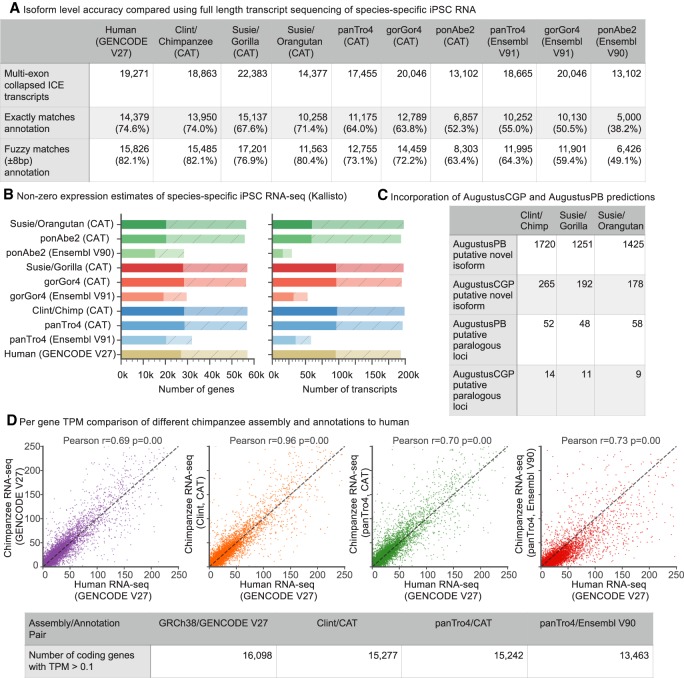
Figure 2.
Primate annotation. (A) Validating CAT annotations using Iso-Seq data. As a baseline comparison, Iso-Seq data from human iPSCs were compared to the GENCODE V27 annotation. Iso-Seq data from chimpanzee, gorilla, and orangutan iPSC lines were compared to respective species-specific annotations. The Iso-Seq data were clustered with isoform-level clustering (ICE) and collapsed using ToFU (Gordon et al. 2015). CAT annotation of PacBio great apes showed similar isoform concordance to human and improvement over the older assemblies. (B) Kallisto (Bray et al. 2016) was used to quantify liver Illumina RNA-seq from each species on both the gene and transcript level on the existing and new great ape assemblies. Solid bars are transcripts or genes with transcripts per million (TPM) >0.1, whereas shaded hatched bars are the remainder of the annotation sets. CAT annotation of great apes shows nearly the same number of expressed genes and isoforms as the GENCODE reference on human with the exception of orangutan. (C) The number of novel isoforms and paralogous genes with Iso-Seq support discovered by analysis of AugustusPB and AugustusCGP predictions for each species. (D) Kallisto protein-coding gene-level expression for chimpanzee iPSC RNA-seq is compared to human across all of the chimpanzee annotation and assembly combinations as well as when mapped directly to human. In all cases, the x-axis is the TPM of human iPSC data mapped to human. The highest correlation (Pearson r = 0.96) is seen when comparing Clint annotated with CAT to GRCh38 annotated with GENCODE V27.

