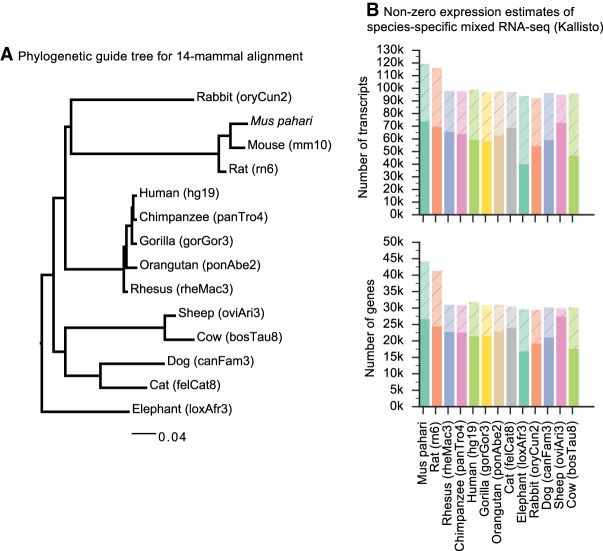
Figure 6.
Thirteen-way annotation. (A) The phylogenetic guide tree for 14-mammal alignment. See Methods for the exact Newick format tree. (B) The gene annotation sets for each of the 13 mammalian genomes were quantified against the mixed input RNA-seq sets obtained from SRA. Genes or transcripts with TPM>0.1 are solid colors, whereas genes or transcripts with no measurable expression are shaded. An average of 2.8 isoforms per gene per genome had quantifiable expression, suggesting that CAT can infer isoform information across long branch lengths.

