Figure 3.
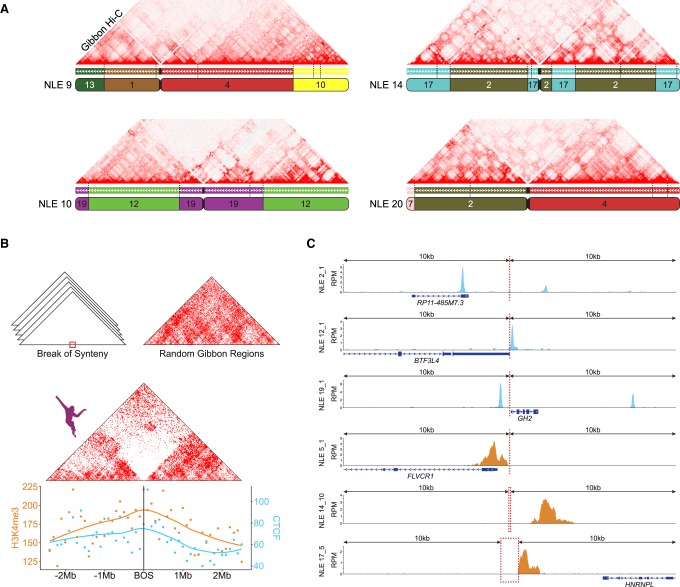
Gibbon–human breaks of synteny display epigenetic signatures of TAD boundaries. (A) As examples, Hi-C matrix for four representative gibbon chromosomes (NLE 9, 10, 14, and 20) are shown along with their corresponding gibbon–human chain from the UCSC Genome Browser. Corresponding human chromosomes are color coded and labeled within each gibbon chromosome ideogram. Positions of all gibbon–human BOS sites are marked on the chain track with vertical dashed lines and demonstrate that chromosomal interactions are often reduced across BOS. (B, center) Averaged interaction maps show juxtaposition of the gibbon Hi-C signal from regions flanking all gibbon–human BOS (±2.5 Mb) and flanking random genomic regions (top right corner). Overall, chromatin contacts are highly depleted across BOS, but not random regions. (Bottom) CTCF and H3K4me3 ChIP-seq peak counts with smoothed Loess curves in 100-kb bins across the BOS (±2.5 Mb) show enrichment of these epigenetic marks at BOS. (C) Examples CTCF (blue) and H3K4me3 peaks (orange) in a 20-kb window around BOS: (RPM) reads per million mapped reads.

