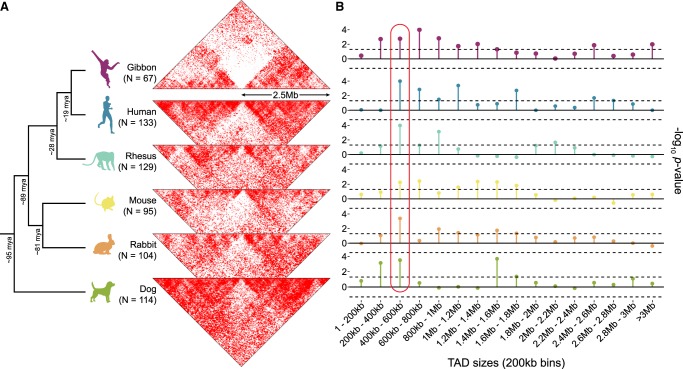
Figure 4.
Evolutionary context of the overlap between TAD boundaries and BOS. (A) The two-dimensional gibbon Hi-C histogram (Fig. 3B) is compared with Hi-C histograms for five other mammalian species at loci orthologous to the gibbon BOS (±2.5 Mbp). Decreased contact density across these loci in non-gibbon species suggests that breakpoint regions in gibbon are more likely to be TAD boundaries in other species. (N) Number of breakpoints that successfully lifted over from the gibbon genome to each species. (B) Lollipop plots show −log10 P-values from permutation analyses testing the overlap between gibbon BOS and TADs binned by size. This cross-species comparison points to consistently significant overlap of BOS with boundaries of 400–600 kb TADs (circled in red). Dotted lines mark P = 0.05 significance threshold (no multiple-test correction).

