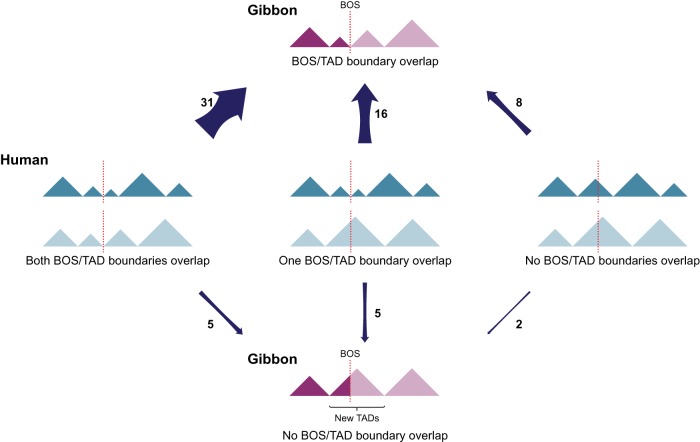
Figure 5.
Alternative evolutionary relationship between BOS and TADs. Schematics show all possible scenarios between BOS (dotted lines) and TADs (triangles) in the gibbon (purple) and human (ancestral, blue) genomes. Arrow width reflects prevalence of the scenario in the gibbon genome, and the number beside the arrow represents the number of occurrences of each scenario.

