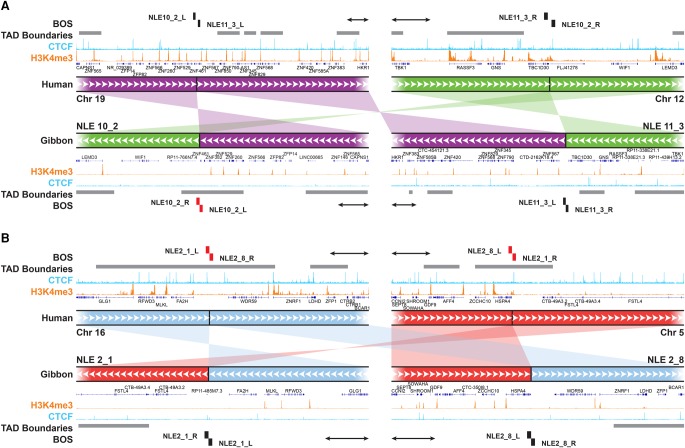
Figure 6.
New TADs and TAD boundaries can emerge from genomic rearrangements. (A) An example of a reciprocal translocation and inversion whose breakpoints (NLE 10_2 and NLE 11_3) do not overlap with TAD boundaries (gray horizontal bars) in human (top tracks). Within the gibbon genome (bottom tracks), breakpoint NLE 11_3 (right) maps within a TAD body, nearby an ancestral boundary, and NLE 10_2 breakpoint (left) corresponds to a new gibbon-specific boundary on NLE 10. ChIP-seq pileups for H3K4me3 (orange) and CTCF (light blue) are shown for human and gibbon. (B) Example of reciprocal translocations in which breakpoints (NLE 2_1 and NLE 2_8) are both within TAD boundaries in human (top tracks) and but not in gibbon (bottom tracks). A new TAD was created by the rearrangement involving NLE 2_1. Gray horizontal bars represent TAD boundaries of every computationally predicted TAD falling into the 500 kb–1 Mb size range. BOS overlapping with boundaries are marked in red. All scale bars represent 100 kb.

