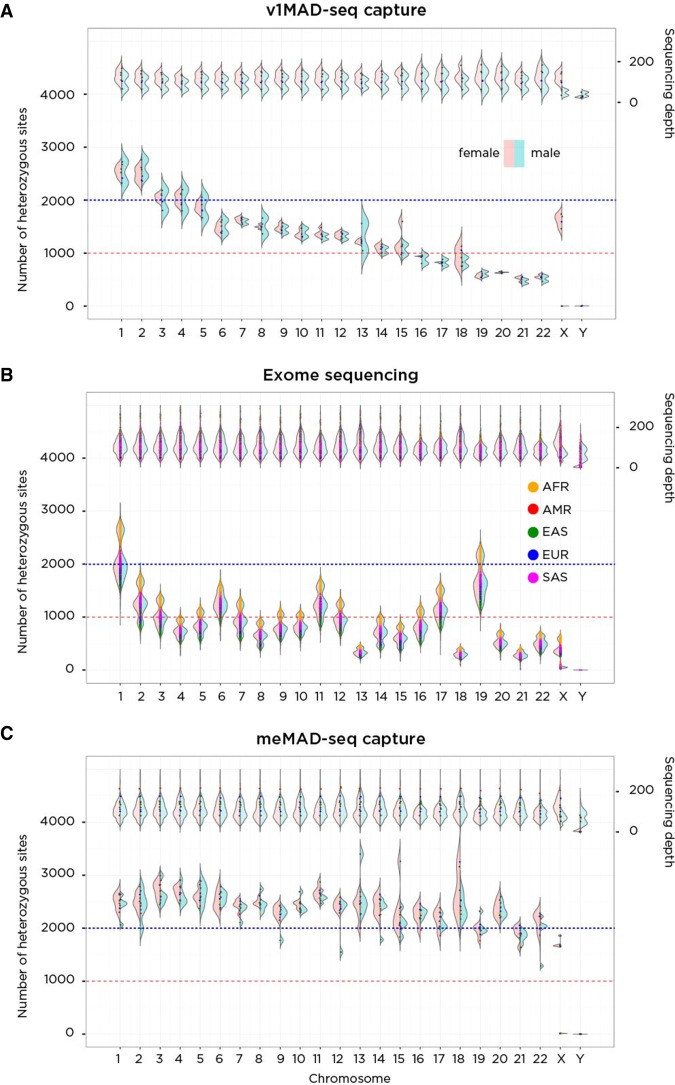
Figure 5.
A performance comparison of v1MAD-seq capture (A), exome sequencing (B), and meMAD-seq capture (C) in terms of the number of heterozygous sites tested per chromosome. On the A, of each plot is a representation of sequencing depth, on the B, the number of heterozygous sites per chromosome. On the left of each violin plot is the distribution in females (pink); on the right, males (blue), allowing differentiation of patterns on the sex chromosomes. The v1MAD-seq capture platform spaced probes evenly throughout the genome, generating more heterozygous sites in larger chromosomes despite equivalent coverage. Exome sequencing (1000 Genomes data) generates a number of heterozygous sites that depend on chromosome size and gene density within the chromosome, so that the comparably sized Chromosomes 18 and 19 differ because of the much greater gene content of the latter. There is also an ancestry effect on heterozygosity rates, with African ancestry performing best and East Asian ancestry worst in generating heterozygous sites. The meMAD-seq capture design allows much more uniform performance of every chromosome in the genome, most exceeding 1500 heterozygous sites per chromosome.

