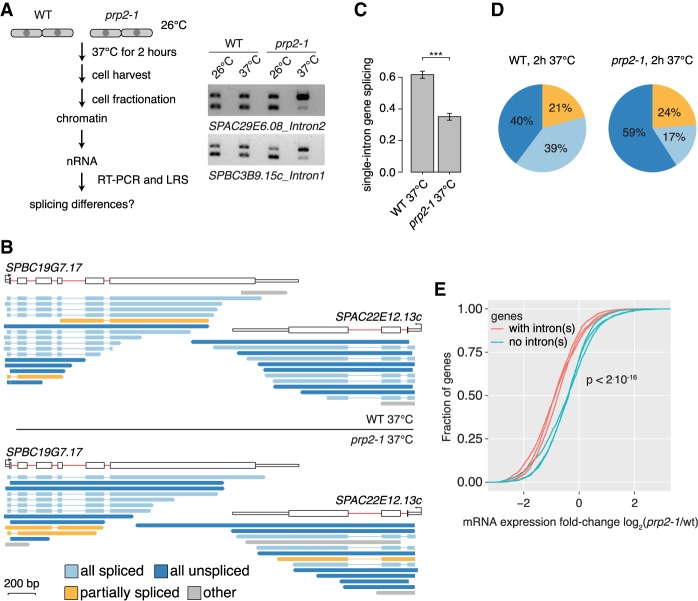
Figure 5.
Inhibition of pre-mRNA splicing increases “all unspliced” nascent transcripts and reduces mRNA levels. (A) Left panel: Schematic of the workflow in the temperature-sensitive prp2-1 mutant and WT strains at nonpermissive temperatures. Right panel: RT-PCR shows increased levels of unspliced nascent RNA in the prp2-1 mutant after 2 h of growth at 37°C for two introns compared to the WT 972h- strain. −RT control was loaded in lanes (empty) adjacent to the +RT samples. (B) Nascent RNA WT and prp2-1 LRS read coverage over two genes. (C) Bar plot indicating splicing frequency for single intron genes in prp2-1 relative to WT at 37°C calculated from LRS data. The standard deviation from three biological replicates is given, and asterisks indicate significance according to the Student's t-test ([***] P < 0.001). (D) Comparison of the “all unspliced,” “all spliced,” and “partially spliced” fractions in the transcriptome in WT and prp2-1. (E) Reduced mRNA levels for intron-containing genes compared to intronless genes in prp2-1 at 37°C. Cumulative distribution of expression changes between prp2-1 mutant and WT for intron-containing and intronless genes (data from three replicates from Lipp et al. 2015; P-value from Kolmogorov–Smirnov test between intronless and intron-containing group).

