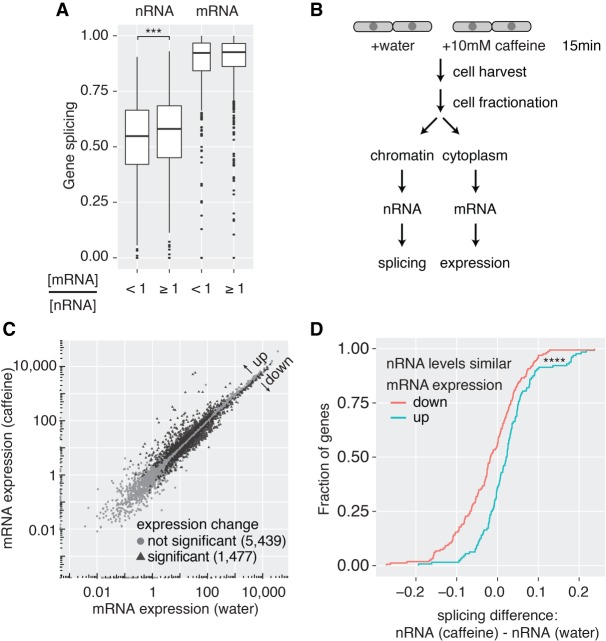
Figure 6.
Cotranscriptional splicing correlates with higher mRNA levels. (A) Box plot of nRNA and mRNA gene splicing levels after grouping according to cytoplasmic mRNA levels relative to nRNA levels ([***] P < 0.001, Wilcoxon rank-sum test). (B) Experimental outline to induce changes in gene expression upon caffeine treatment in S. pombe cells. (C) Correlation of mRNA expression values between the two conditions identifies 1477 differentially expressed genes (FDR-adjusted P-value < 0.05, FDR ≤0.05; 566 of those are intron-containing). (D) Cumulative distribution of nRNA gene splicing differences between caffeine treatment and control. Only genes without significant changes in nRNA levels but significant differences in mRNA expression were considered ([****] P < 0.0001, Kolmogorov–Smirnov test between “mRNA expression up” [n = 52] and “mRNA expression down” [n = 65] group).

