Figure 7.
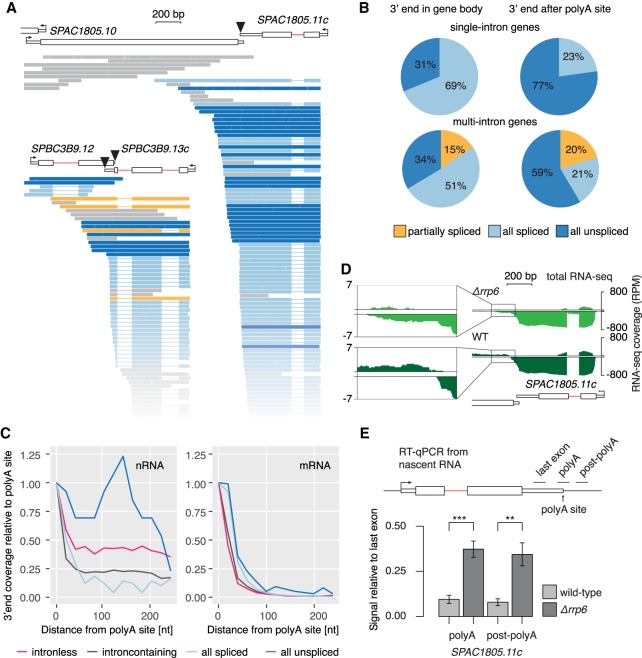
Coupling between cotranscriptional splicing, polyA site cleavage, and mRNA stability. (A) Examples of intron-containing genes with unspliced transcripts extending over the polyA site. Black triangles mark the polyA cleavage sites. Full representation of all sequenced transcripts in Supplemental Figure S8B. (B) Pie charts reflecting the fraction of spliced and unspliced transcripts in single or multi-intron genes with 3′ ends either within the gene body or downstream from the polyA site cleavage site. (C) 3′ end profiles downstream from annotated polyA cleavage sites for different transcript classes. Data are binned in 20-nt intervals and normalized to the first bin (−20 nt – 0 nt from polyA cleavage site). (D) WT and Δrrp6 total RNA-seq read coverage over the same example gene as in A is shown (log-scale). Counts per nucleotide were normalized to library size. Data reanalyzed from Zhou et al. (2015). The inset zooms into the region downstream from the annotated polyA site. (E) Nascent transcript levels with 3′ ends extending over the polyA site are increased in the exosome mutant Δrrp6. RT-qPCR from Δrrp6 and WT strains confirmed higher levels of nascent RNA uncleaved at the polyA cleavage site, using qPCR primers to generate amplicons (black line above gene diagram) bridging (polyA) or downstream (post-polyA) from the polyA cleavage site (RT with random hexamers). SDs from four biological replicates are given. Asterisks indicate significance according to Student's t-test: (**) P < 0.01, (***) P < 0.001.

