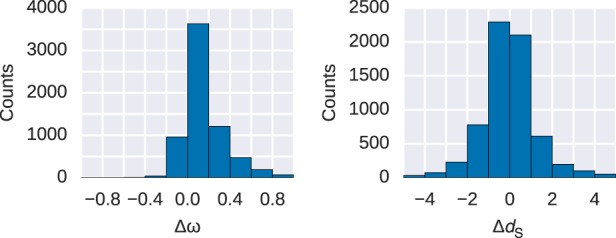
Figure 1.

Histograms of paired differences in ω (ω = dN/dS) and dS values in proteins with disordered and ordered protein regions. Shown are the pairwise differences in disordered minus ordered protein regions (Δω and ΔdS) of the same protein. Substitution rates for nonsynonymous (dN) and synonymous (dS) sites are obtained from a one-ratio model. ω values are significantly different for ordered and disordered regions (Wilcoxon signed-rank test, paired, P < 2.2 × 10⁻¹⁶); the difference dS has a greater P-value (P < 4 × 10⁻⁴).
