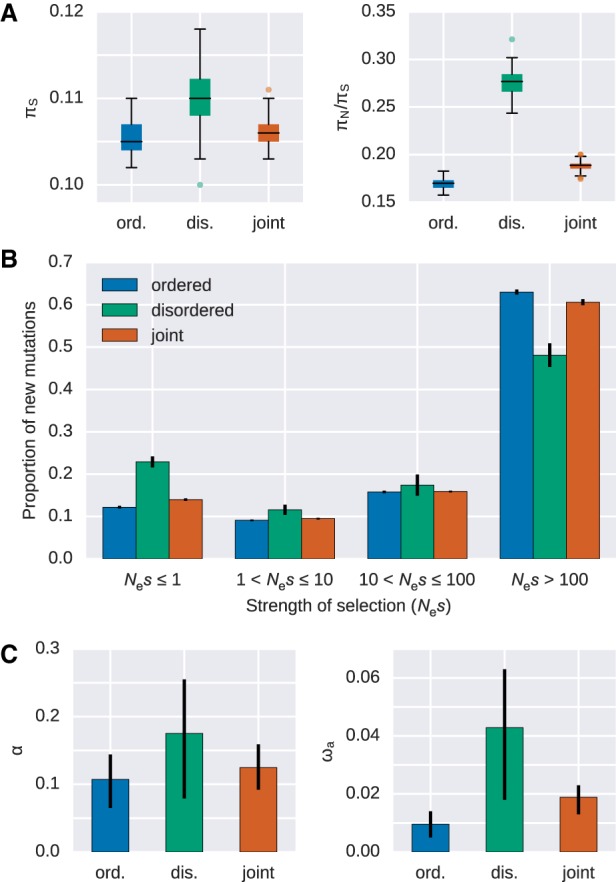
Figure 4.

Evidence for differences in the selective effects in disordered and ordered protein regions in humans. (A) Nucleotide diversity at synonymous sites (πS, left panel) and the ratio of nucleotide diversity at nonsynonymous sites over synonymous sites (πN/πS, right panel) for ordered, disordered, and jointly obtained protein regions in humans. (B) The distribution of fitness effects of nonsynonymous mutations estimated separately for ordered and disordered protein regions, as well as when jointly estimated. Error bars represent the standard error. Nes denotes the effective population size (Ne) scaled strength of selection (s). (C) Estimates of the role of positive selection for the analyzed protein set. The proportion of nonsynonymous substitutions that can be attributed to positive selection (α) and the adaptive divergence relative to the synonymous divergence (ωa) estimated separately for ordered and disordered protein regions, as well as when jointly estimated. All pairwise comparisons are significantly different (Wilcoxon signed-rank test, paired, P < 3 × 10⁻¹²).
