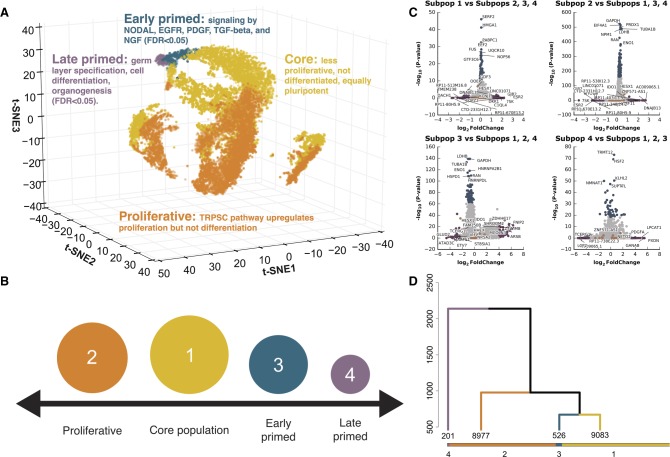
Figure 1.
Identification of four cell subpopulations from 18,787 hiPSC cells, sequenced from five biological replicates. (A) Three-dimensional t-SNE distribution of cells based on gene expression value. Each point represents a single cell in three-dimensional space. A t-SNE transformation of the data was used for positioning cells; four cell subpopulation labels (marked by different colors) represent results from clustering and are independent of t-SNE data transformation (for an interactive, searchable figure, see http://computationalgenomics.com.au/shiny/hipsc/). Pathway analysis based on differential expression identified functional properties that distinguish each subpopulation. (B) Four pluripotent subpopulations functionally separated from a homogeneous hiPSC population. (C) The top significantly differentially expressed genes of cells in a subpopulation compared to cells in the remaining three subpopulations. Genes denoted with orange points are known naive and primed markers. Genes represented with blue and purple points are those in the top 0.5% highest logFC or −log(P-value), respectively. (D) Unsupervised clustering of all cells into four subpopulations. The dendrogram tree displays distance and agglomerative clustering of the cells. Each branch represents one subpopulation. The clustering is based on a Dynamic Tree Cut that performs a bottom-up merging of similar branches. The number of cells in each of the four subpopulations are given below the branches.

