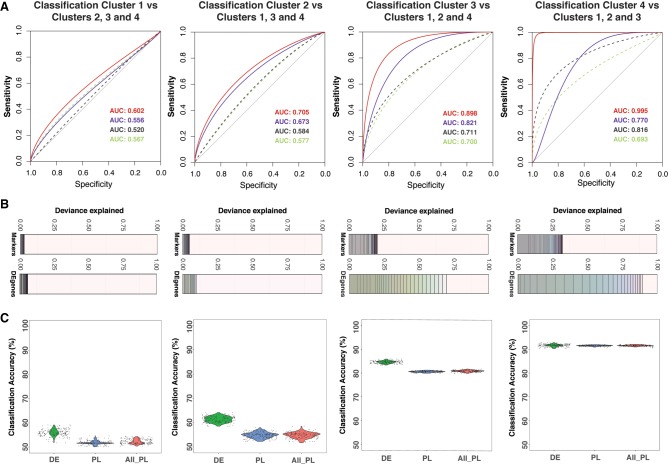
Figure 3.
Selection of significant gene predictors for classifying each subpopulation using LASSO regression. (A) For each subpopulation, a LASSO model was run using a set of differentially expressed (DE) genes and another set of known markers. Dashed lines are receiver operating characteristic (ROC) curves for models using known markers. Continuous lines are for models using differentially expressed genes. The text shows corresponding area under the curve (AUC) values for ROC curves. For each case (known markers or DE genes), a model with the lowest AUC and another model with the highest AUC are given. Lower AUC values (and ROC curves) in the prediction models using known markers suggested that the models using DE genes performed better in sensitivity and specificity. (B) Each deviance plot shows the deviance explained (x-axis) by a set of gene predictors (numbers of genes is shown as vertical lines and varies from 1 to maximum value as the total number of gene input or to the minimum number of genes that can explain most of the deviance). The remaining space between the last gene and 1.0 border represents deviance not explained by the genes in the model. (C) Classification accuracy calculated using a bootstrap method using all known markers (both pluripotent markers and primed lineage markers) or markers from our differentially expressed gene list is shown. Expression of LASSO-selected genes for subpopulation one and subpopulation two is shown in Supplemental Figure S7. The x-axis labels are for three cases: using LASSO-selected differentially expressed genes (DE); LASSO-selected pluripotency/lineage-primed markers (PL); and all pluripotency/lineage-primed markers (All PL).

