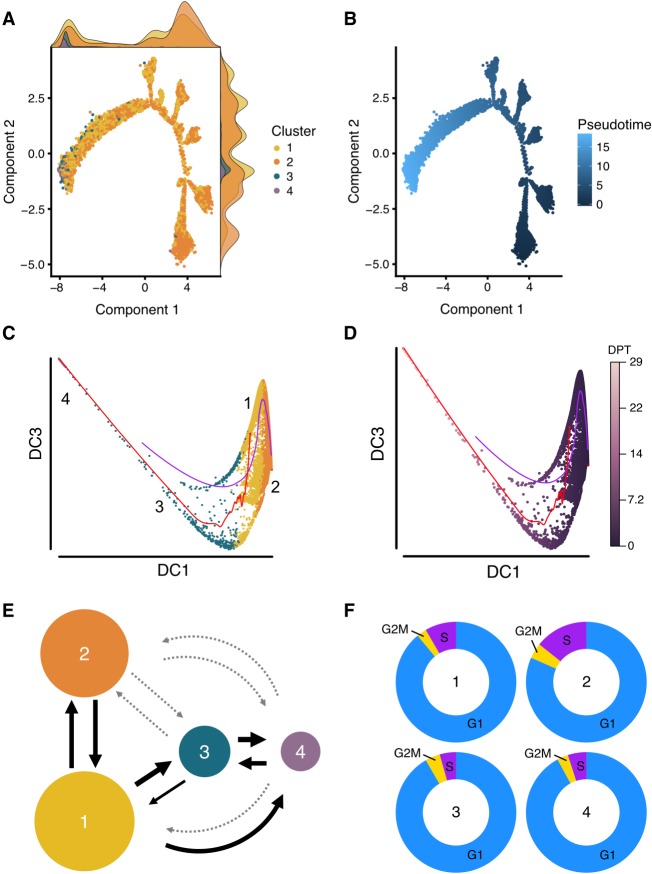
Figure 4.
Trajectory and cell cycle membership analysis. Cell differentiation potential was mapped using two pseudotime approaches implemented in Monocle 2 and Destiny and a novel transition estimation method. (A) The results of the Monocle 2 analysis, colored by subpopulation, and the normalized density of the cells in each location along the trajectory is shown as a density curve in the x and y plot margins. (B) The differentiation distance from the root cell to the terminal state, for which the dark blue represents the beginning (the root) and light blue represents the end (the most distant cells from the root) of the pseudotime differentiation pathway. (C,D) The results of diffusion pseudotime analysis, colored by cluster (C) and by diffusion pseudotime (D). DC refers to diffusion component, and DPT refers to diffusion pseudotime. The red and blue pathways in C and D represent the transition path from cell to cell calculated by a random-walk algorithm. (E) We developed a novel approach that uses the LASSO classifier to quantify directional transitions between subpopulations. The percent of transitioning cells predicted between subpopulations. The weight of the arrows is relative to percentage (thicker is higher percentage), and the light gray dotted arrows represent percentages lower than 20. (F) Cell cycle stages were predicted for each cell by subpopulation. Subpopulation one (“Core”) contains a significantly lower number of cells in the S phase (synthesis) compared to subpopulation two (“Proliferative”; Fisher's exact test, P < 2.2 × 10⁻¹⁶).

