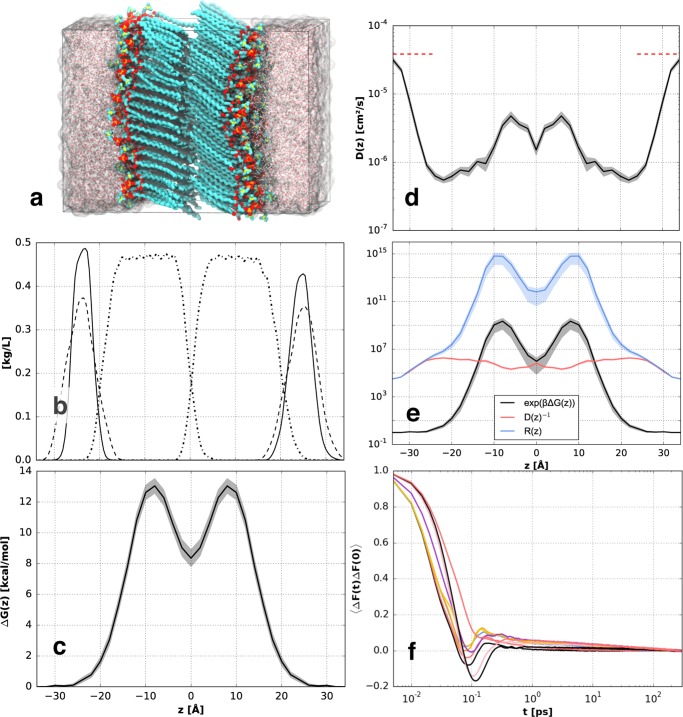
Figure 3.
(a) Simulation snapshot of a DSPC bilayer, (b) mass density profile of choline (dashed lines), phosphate/glycerol (solid lines), and the lipid tails (dash-dotted lines), (c) the excess free energy profile, and (d) diffusion profile corresponding to water permeating a gel-phase DSPC bilayer, with the reference bulk SPC water diffusion at 298 K49 indicated by the red dashed lines, (e) resistance profile with the contributions due to free energy and diffusion, (f) z-force autocorrelation function for different windows ranging from the aqueous phase to the bilayer center. The shaded areas in (c)–(e) indicate the statistical uncertainty calculated from multiple sweeps.

