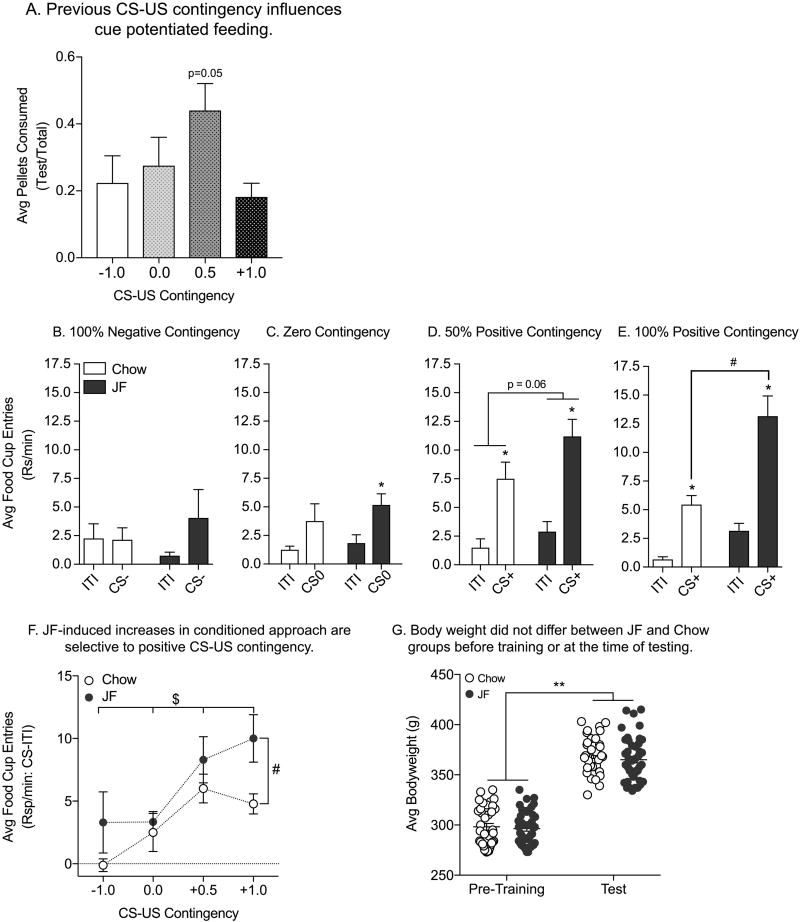
Figure 2.
Test for Cue Potentiated Feeding and Conditioned Approach: A) Average proportion of pellet consumption during CS presentations (±SEM). No effects of JF were found, so data are collapsed across JF and Chow groups (see Supplemental Fig 3 for Chow vs. JF comparisons). Modest cue potentiated feeding was found only in the 50% Positive Contingency group (+0.5) compared to the 100% Negative Contingency group (−1.0). B–E) Average rate of food cup entries (±SEM) during the ITI and CS periods. B) In the Negative Contingency groups, rates of food cup entries were similar during the ITI and CS− period, and there was no effect of JF. C) In the Zero Contingency groups, CS0 presentation resulted in modest increases in food cup entries relative to the ITI in the JF but not Chow group. D) In the 50% Positive Contingency groups, the CS+ elicited conditioned approach in both JF and Chow groups, with significantly greater rates of food cup entries during the CS vs. ITI. In addition, responding was modestly enhanced in the JF vs. Chow group. E) In the 100% Positive Contingency groups, the CS+ elicited conditioned approach in both groups, and this effect was enhanced in the JF vs. Chow group. F) Summary of conditioned approach in chow and JF groups across CS-US contingency. Conditioned approach varied as a function of CS-US contingency in both groups and JF consumption enhanced conditioned approach to the 100% Positive CS+. G) Average body weight (±SEM) for Chow and JF groups. Weight did not differ between groups either prior to initial conditioning, nor at the time of testing. All rats gained significant weight between pre-training and testing. * = planned comparisons, CS vs. ITI, p<0.05; # = main effect of diet, p<0.05; $ = main effect of training; ** = main effect of time, p<0.05.

