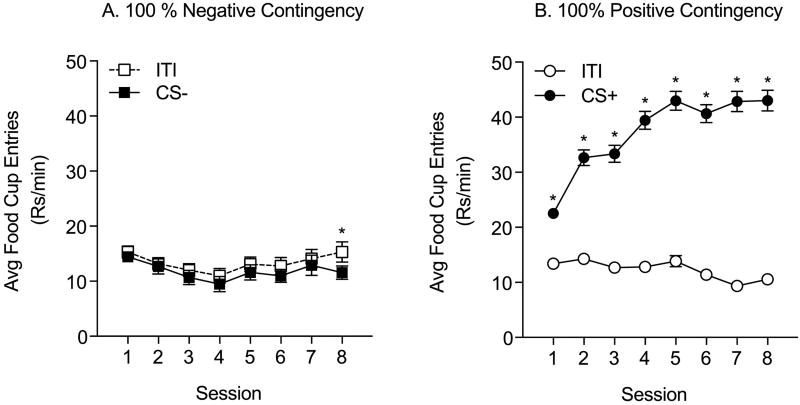
Figure 5.
Pavlovian Conditioning, Experiment 2: Average food cup entries during the ITI and CS presentations across conditioning sessions are shown for each contingency group (±SEM). A) 100% Negative Contingency: By the end of training, the rates of food cup entries during the ITI were modestly, though significantly higher than during the CS−. B) 100% Positive Contingency: The rate of food cup entries was greater during CS+ vs. ITI presentations, and this difference increased significantly across sessions. * = post-hoc comparisons, ITI vs. CS, p<0.05.

