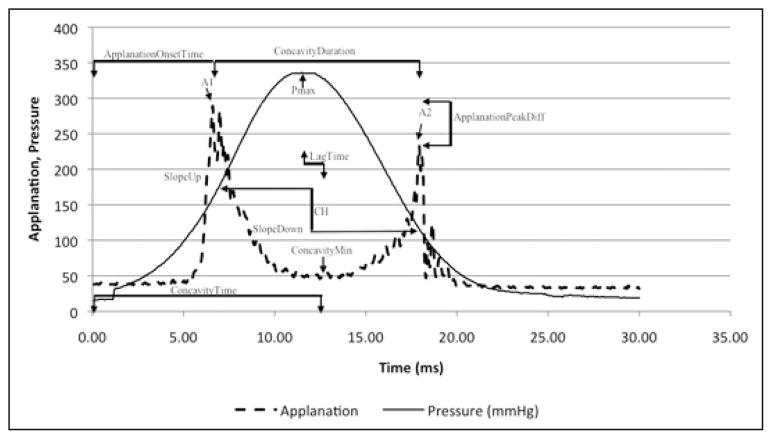
Figure 1.
Ocular Response Analyzer (ORA) (Reichert Ophthalmic Instruments, Depew, NY) signal output with select variables from applanation signal intensity (A1, A2, Applanation peak difference, and Concavity min); pressure (Pmax); time (concavity duration, concavity time, and lag time); applanation signal intensity as a function of response time (slope up and slope down). CH = corneal hysteresis

